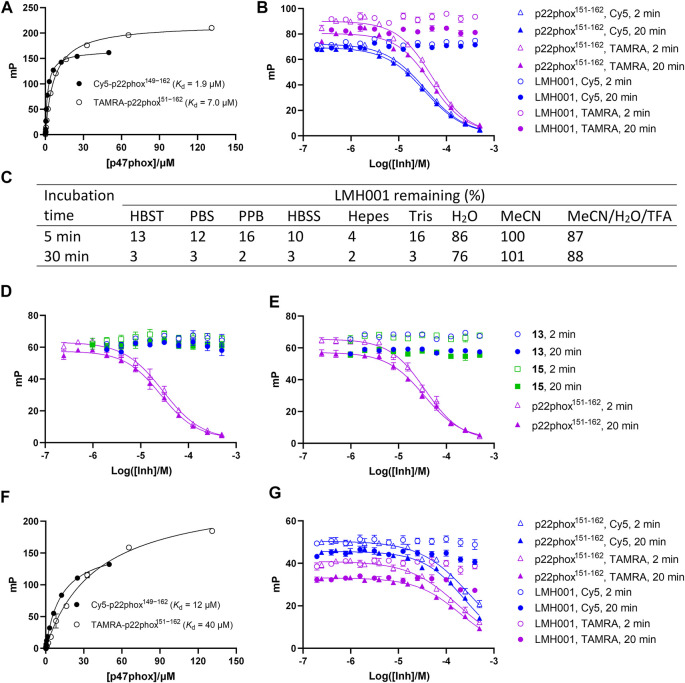
FIGURE 3.
(A–B and D–G) Interaction of LMH001 and its breakdown products (13, 15) with p47phoxSH3A–B measured by FP. The binding constant (K d) between p47phoxSH3A–B and Cy5-p22phox149–162 or TAMRA-p22phox151–162 in 1×HBST (A) or water (F). Inhibition of the p47phoxSH3A–B/Cy5-p22phox149–162 or p47phoxSH3A–B/TAMRA-p22phox151–162 interaction with LMH001 in 1×HBST (B) or water (G) over 2 min or 20 min incubation. The unlabeled p22phox151–162 peptide was used as positive control. In 1×HBST, p22phox151–162 showed a K i value of 14–22 µM when using Cy5-p22phox149–162 and a K i value of 17–31 µM when using TAMRA-p22phox151–162 over 2–20 min. In water, p22phox151–162 showed a K i value of 170–220 µM when using Cy5-p22phox149–162 and a K i value of 140–155 µM when using TAMRA-p22phox151–162 over 2–20 min (C) LC–MS stability studies of LMH001 over time (5, 30 min) in different buffers. The percent remaining is measured by comparing AUC (UV250) of the LMH001 peaks in buffers at 5 or 30 min with AUC (UV250) of LMH001 in MeCN at 5 min. Inhibition of the p47phoxSH3A–B/Cy5-p22phox149–162 (D) or p47phoxSH3A–B/TAMRA-p22phox151–162 (E) interaction by 13 or 15 in the FP assay using 1×HBST and 2 or 20 min incubation.

