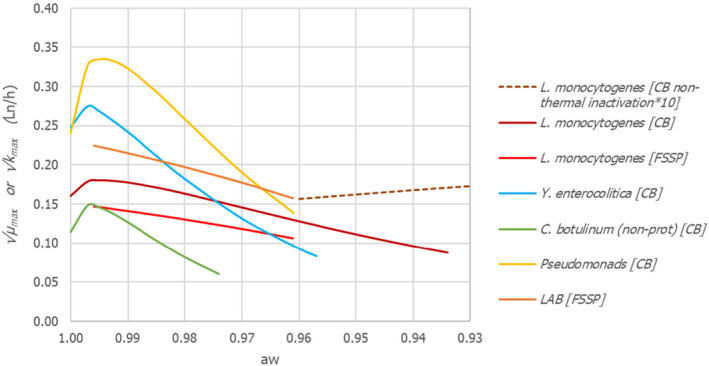
Figure 4.

Growth rate (as square root of μ max ) at 4°C as a function of aw of relevant pathogenic and spoilage bacteria according to predictive models (input value for pH = 6), CB: ComBase; FSSP: Food Spoilage and Safety Predictor. Dotted line represents the square root of the inactivation rate (k max multiplied by 10 to present on the same scale) according to the non‐thermal survival model of ComBase
