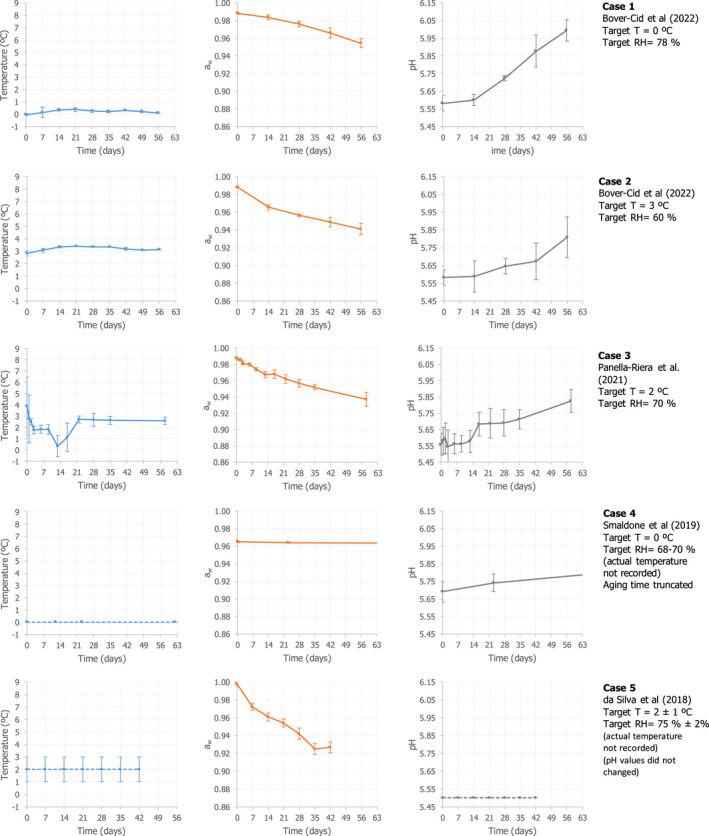
Figure 5.

Measured, pH and aw values during dry‐ageing of beef for different process conditions (target temperature and RH) reported in the literature used as realistic examples. For case 4 and 5 temperature represent the target value (represented as dotted lines)
