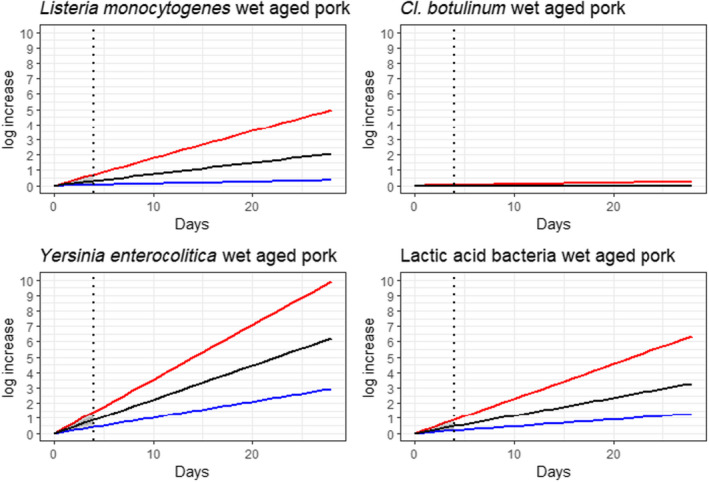
Figure 8.

Predicted log10 increases of selected pathogens and spoilage bacteria during wet‐ageing of pork. The solid lines are the minimum (blue), median (black) and maximum (red) log10 increases during prolonged ageing based on constant mean growth rates. These growth rates were estimated from the variable log10 increases during the standard fresh meat preparation time (dotted vertical line). Light grey indicates the min and max variable range of log10 increases and dark grey the 5 and 95 variable percentile range
