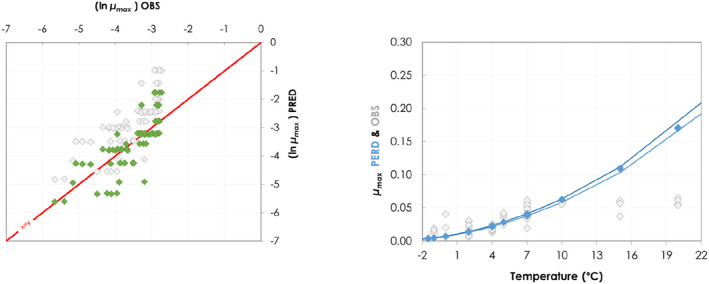
Comparison between the Ln transformed values of
observed for lactic acid bacteria in vacuum packaged raw meat and the predictions provided by the model of Mejlholm & Dalgaard (Mejlholm and Dalgaard,
2007,
2013). In the plot on the left, red line represents the equivalence (i.e., predictions equal to observations). Grey dots represent the uncorrected predictions, while green points represent the corrected values after applying the calibration factor. Plot on the right show the observed
(grey) versus the predicted
(blue) as a function of the temperature of the experiment. The predictions for two different extreme pH values are also represented with the lines for an illustrative purpose
Data from: (Barrera et al.,
2007) Barrera et al. (
2007); IRTA unpublished data; ComBase records ID: L‐1MRSA1; L‐1MRSA2; L‐1MRSAn1; L‐1MRSAn2; L2MRSA1; L2MRSA2; L2MRSAn1; L2MRSAn2; L7MRSA1; L7MRSA2; L7MRSAn1; L7MRSAn2; L_LAB0_1; L_LAB0_2; L_LAB‐1.5_1; L_LAB2_1; L_LAB2_2; L_LAB4_1; L_LAB4_2; L_LAB7_1; S_LAB0_1; S_LAB‐1.5_1; S_LAB2_1; S_LAB2_2; S_LAB4_1; S_LAB7_1; S_LAB7_2; CB01k_1_12; CB02k_1_12; CB03k_1_12; CB04k_1_12; CB05k_1_12; CB05k_2_12; CB05k_3_12; CB06k_1_12; CB06k_2_12; CB06k_3_12; CB07k_1_12; CB07k_2_12; CB07k_3_12; CB08k_1_12; CB08k_2_12; CB08k_3_12.

