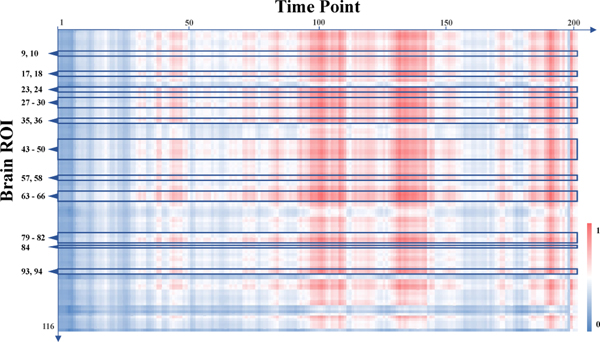
Fig. 3.
Visualization of group-level feature differences learned by the proposed method from temporal perspective. Red and blue represent large and small feature differences between MDD patients and HC subjects, respectively. The ROIs noted on the left side are all brain regions associated with top 30 discriminative functional connectivities (refer to Table 4), and the ROI IDs are consistent with those in standard AAL-116 template.

