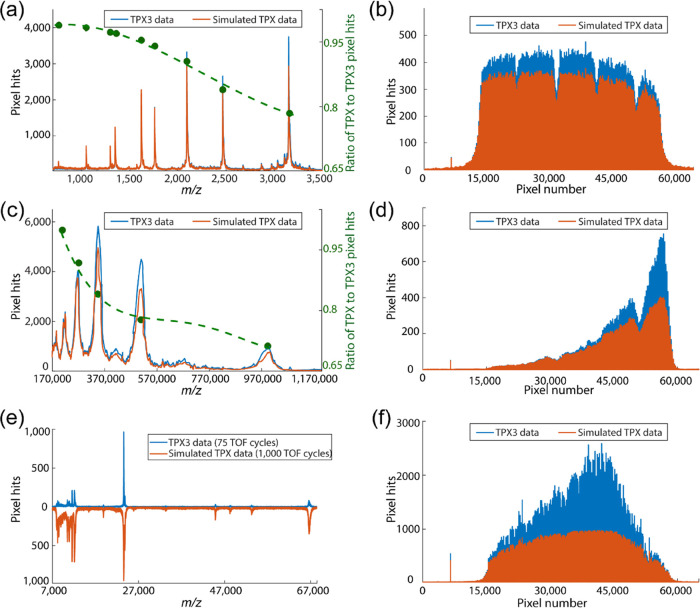
Figure 4.
Mass spectra (a, c) and pixel histograms (b, d) plotted in event-based (TPX3, blue trace) and frame-based (TPX, orange trace) modes for two different mass ranges: Bruker peptide calibration standard II (m/z range: 700–3200 Da, data 1 (top), in CHCA matrix) and IgM (m/z range: 190–970 kDa, data 2 (middle), in SA matrix) for 1000 laser shots. Green trace in (a) and (c) plots the ratio of signal intensity in TPX and TPX3 modes. Bruker protein calibration standard II (m/z range: 10–70 Da, data 3 (bottom), in SA matrix) mass spectrum (e) plotted in event-based mode by the accumulation of 75 TOF cycles and in frame-based mode by the accumulation of 1000 laser shots, and pixel histograms (f) plotted for 1000 laser shots in both modes. The spectra are generated by summing up the number of pixels activated for each 1.5625 TOA bin. The pixel histograms are generated by summing up the frequency of pixel activation of each pixel in the 256 × 256 TPX3 pixel array (65,536 pixels) for 1000 laser shots. Data acquisition parameters are listed in Table S1 (Supporting Information).

