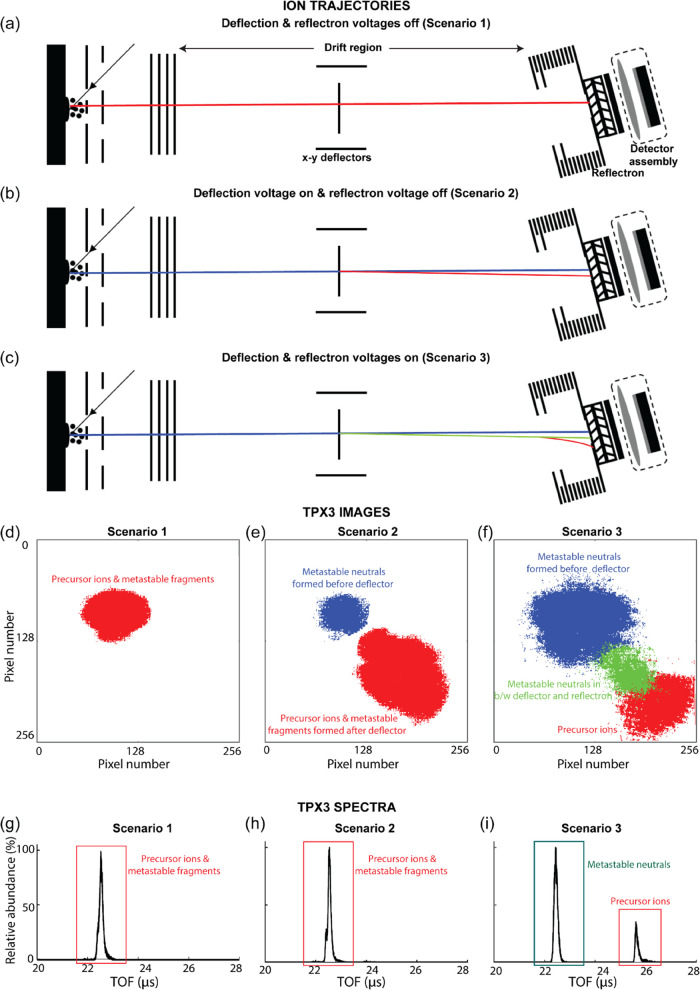
Figure 5.
Ion trajectory (a–c) and the resulting total ion TPX3 image (d–f) and TOF spectrum (g–i) produced from insulin chain B [M + H]1+ ions (in CHCA matrix) for three different conditions; (1) without deflection and reflectron voltages, (2) with deflection voltage (x and y deflection voltages: −55 and −65 V), and (3) with deflection and reflectron voltages (x and y deflection voltages: −55 and −65 V, reflectron voltage: 19.5 kV). The ion trajectories and corresponding spatial distributions at the TPX3 detector of each type of ion cloud are represented using the same color in all three scenarios. The mass spectra were generated by the summation of the number of ion events over successive 1.5625 ns time windows in each TOF cycle for 5000 laser shots. The details on the plotting of TPX3 images and ion events spectrum are provided under the “Data Acquisition and Analysis” section. Data acquisition parameters are listed in Table S1 (Supporting Information).

