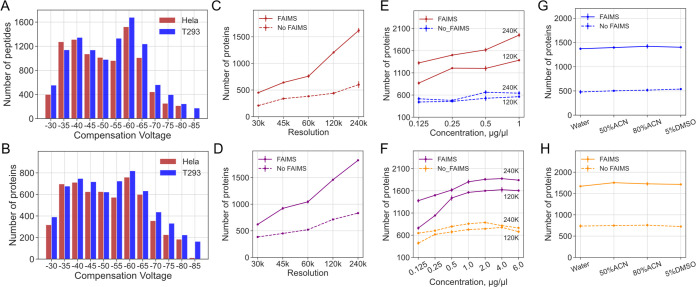
Figure 2.
Protein identifications from HeLa and 293T proteomes by DISPA analysis across different experimental parameters. (A,B) Peptide (A) and protein (B) identifications at various FAIMS CVs using DISPA for 293T and HeLa proteomes. Mass resolution: 120 K. Concentration: 293T: 1 μg/μL. HeLa: 0.5 μg/μL. (C,D) Number of protein identifications as a function of mass resolution in HeLa (C) and T293 (D) with and without FAIMS. (E,F) Number of protein identifications as a function of sample concentration in HeLa (E) and 293T (F) with and without FAIMS. (G,H) Number of protein identifications as a function of resuspension solvent in HeLa (G) and 293T (H) with and without FAIMS.

