Figure 3.
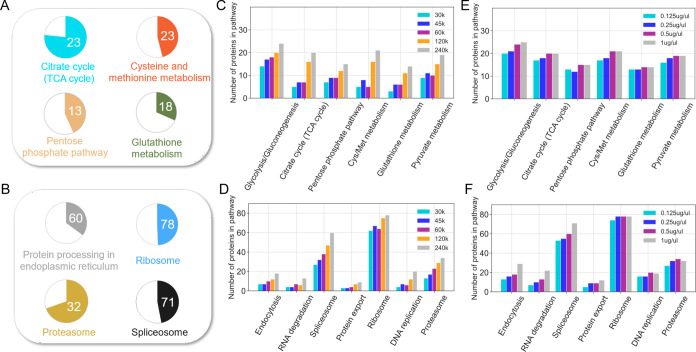
KEGG pathway enrichment analysis of proteins identified by DISPA from HeLa cells. (A,B) The number in pie charts indicates how many proteins in the pathway were identified, and the colored proportion of each circle reflects the coverage of the proteins in each pathway using a mass resolution of 240 K and a concentration of 1 μg/μL. (C,D) Variation in the number of detected protein groups of various pathways with different resolution settings using a sample concentration of 0.5 μg/μL. (E,F) Variation of detected protein groups of various pathways as a function of peptide concentration using a mass resolution of 240 K.

