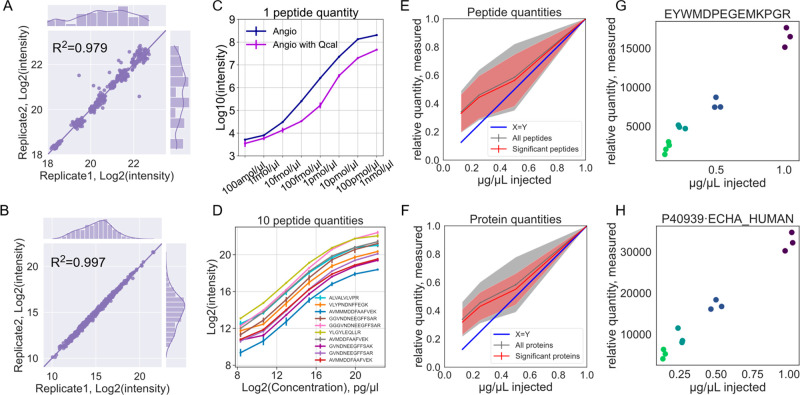
Figure 4.
Label-free quantification with DISPA using standards. (A,B) Scatterplot of peptide fragment intensities from two injections of the MS-QCAL protein (A) and HeLa peptides (B). (C,D) Quantification curve of a standard peptide angiotensin I (C) and MS-QCAL protein (D) at different concentrations. (E,F) Peptide (E) and protein (F) quantities determined by DISPA-LFQ from a dilution series of the HeLa proteome. The shaded area represents one standard deviation from the mean in the middle. Only peptides or proteins with positive slopes were plotted in either set, which excludes 60 peptides or 18 proteins before the Pearson test for good slope (p value < 0.05) or 3 peptides and zero proteins after the Pearson test for slope (p value < 0.05). Significant peptides or proteins were defined as those with a p value from the Pearson correlation of less than 0.05. (G,H) Examples of well-quantified peptide (G) and protein (H).

