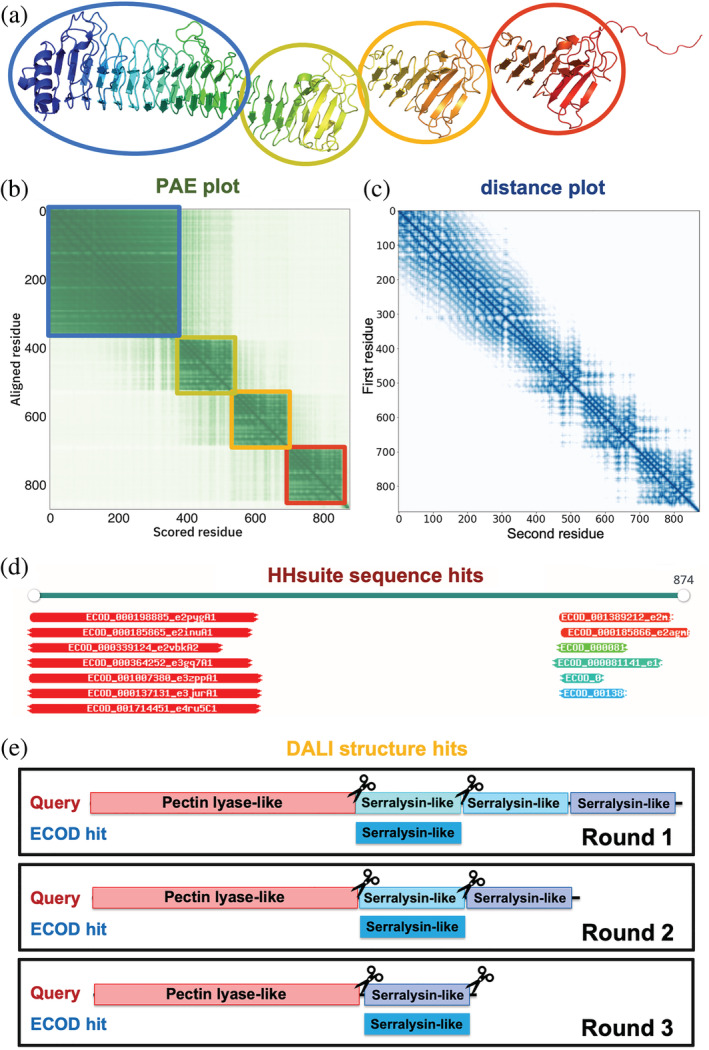
FIGURE 1.

Evidence to parse an AF model into globular domains. (a) An example AF model (UniProt accession: Q9ZFH0). (b) PAE plot for the same model. As the PAE value increases, the color changes from dark green to light green. Residues in the blue, yellow, orange, and red circles in (a) correspond to the blue, yellow, orange, and red squares in (b) with lower PAE values inside. (c) Minimal inter‐residue distance plot for the same model. The color changes from dark blue to light blue as distance increases. (d) Similar sequences detected by HHsuite. (e) Similar structures detected by Dali. We aligned an ECOD hit to a query in an iterative fashion to allow the detection of duplicated domains in the query
