
Fig. 2.
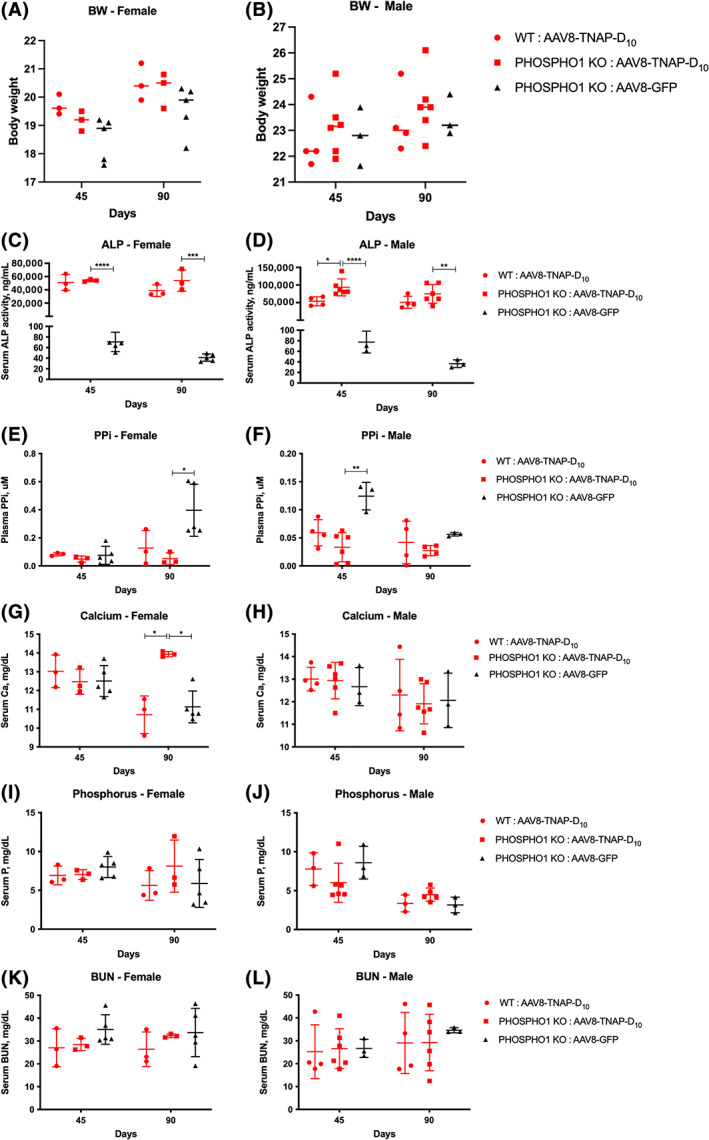
Biochemical analysis in serum/plasma from Phospho1 knockout (KO) mice under AAV8‐TNAP‐D10 treatment or AAV8‐GFP as control after 45 and 90 days of injection. Wild‐type (WT) littermates were treated with the AAV8‐TNAP‐D10 vector. (A, B) Body weight. (C, D) Serum alkaline phosphatase activity. (E, F) Plasma PPi levels. (G, H) Serum calcium concentrations. (I, J) Serum phosphorus concentrations. (K, L) Blood urea nitrogen (BUN) levels in serum. Sample size of the cohorts was as follows: (i) Phospho1 KO: AAV8‐TNAP‐D10 female n = 3, male n = 6; (ii) Phospho1 KO: AAV8‐GFP female n = 5, male n = 3; (iii) WT: AAV8‐TNAP‐D10 female n = 3, male n = 4. Statistical analysis was performed by one‐way ANOVA followed by Tukey's multiple comparison test. *p < 0.05; **p < 0.01; ***p < 0.001. ****p < 0.0001.