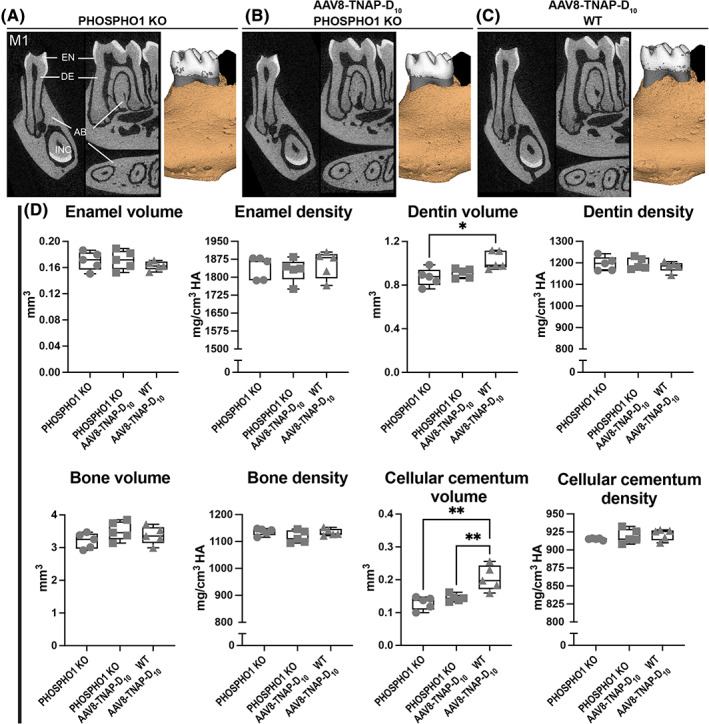
Fig. 8.

Micro‐CT analysis of dentoalveolar complex from Phospho1 knockout (KO) and wild‐type (WT) littermates. 2D and 3D micro‐CT images of (A–C) first molar (M1) and incisor (INC) from AAV8‐TNAP‐D10‐ or AAV8‐GFP‐treated mice 90 days after injection. (D) Quantification of molar enamel, dentin, alveolar bone, and cellular cementum parameters. No obvious difference in tissue organization, or periodontal attachments, except for higher dentin and acellular cementum volumes from AAV8‐TNAP‐D10‐treated WT mice when compared with Phospho1 KO mice treated with AAV8‐TNAP‐D10 and AAV8‐GFP. Statistical analysis was performed by one‐way ANOVA followed by Tukey's multiple comparison test. Differences were statistically significant at *p < 0.05 and **p < 0.01. AB = alveolar bone; DE = dentin; EN = enamel.
