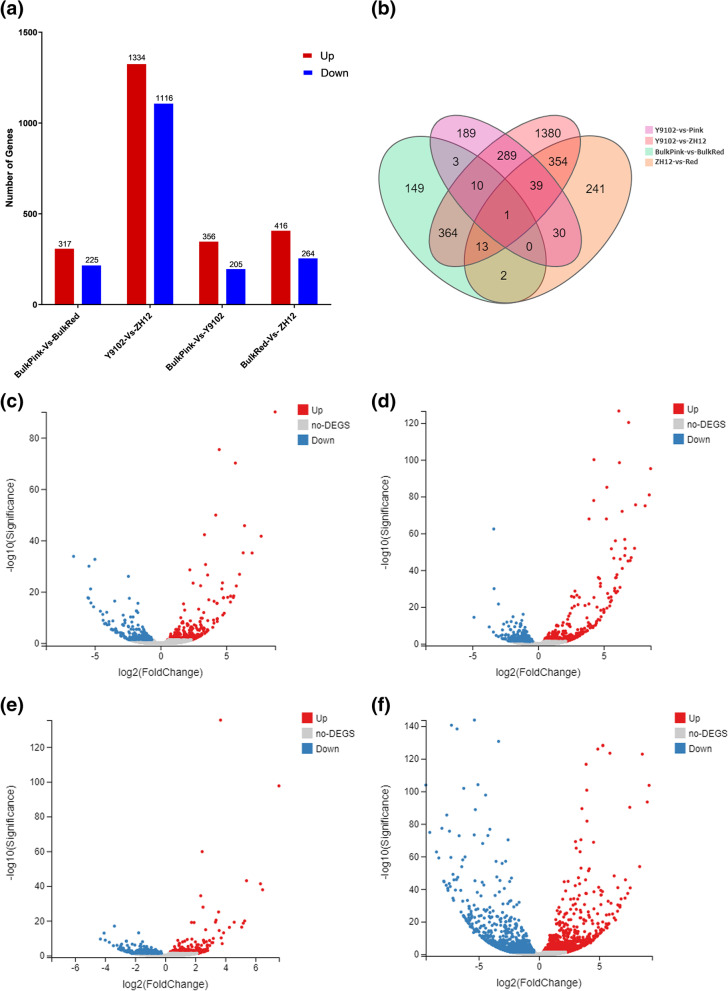
Fig. 2.
Significant changes of differentially expressed genes in in bulk red and bulk pink type peanuts compared to ZH12 (red parent) and Y9102 (pink parent) (a) Statistics of up-regulated and down-regulated differentially expressed genes (DEGs) in each experimental group (b) Venn diagram analysis of pink-vs-Y1902, red-vs-ZH12, ZH12-vs-Y9102 and bulk red-vs-bulk pink dataset. The volcano plot of the both up-regulated and down-regulated DEGs in (c) bulk pink-vs-Y1902 (d) bulk red-vs-ZH12 (e) bulk red -vs-bulk pink type peanuts (f) ZH12-vs-Y9102 type peanuts. The X-axis represents log2-transformed fold-difference values, and the Y-axis represents -log10-transformed significance values. Red dots represent up-regulated DEGs, blue dots represent down-regulated DEGs, and gray represent non-DEGs

