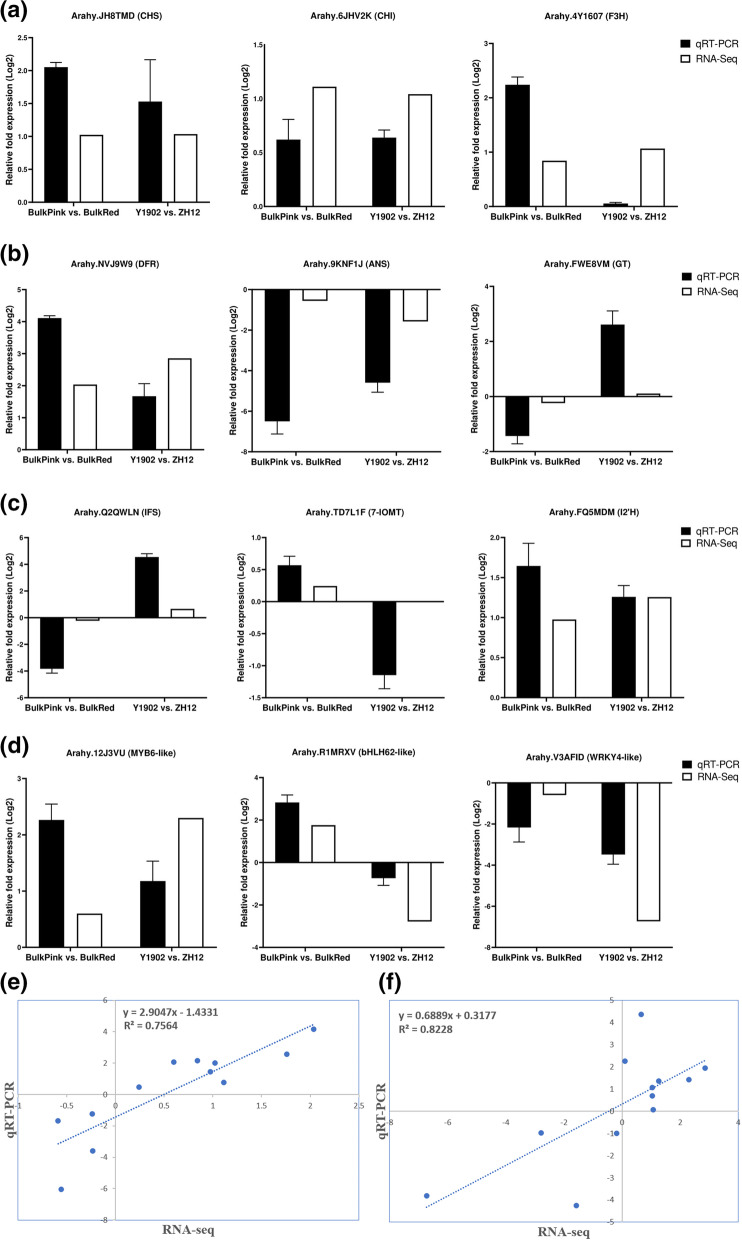
Fig. 7.
Validation of gene expression level of the key functional genes likely to be involved during the regulation of pink and red testa in peanut using qRT-PCR assay (a) DEGs selected from the up-stream regulatory anthocyanin pathway (b) DEGs selected from the down-stream regulatory anthocyanin pathway (c) DEGs selected from the iso-flavonoid regulatory pathway (d) DEGs encoding important transcription factors involved in anthocyanin pathway in peanut. Pearson’s correlation analysis of the RNA-seq and qRT-PCR in (e) bulk pink-vs-bulk red peanuts and (f) Y9102-vs-ZH12 peanuts. The black bars in the y-axis indicate the relative expression level of genes quantified by qRT-PCR, whereas the white bars indicate the expression results from the transcriptome data. The x-axis demonstrates the expression results obtained from bulk pink-vs-bulk red and Y9102-vs-ZH12 testa peanuts. The data were presented as means of three independent biological replicates, and error bars denote ± SE (n = 3)

