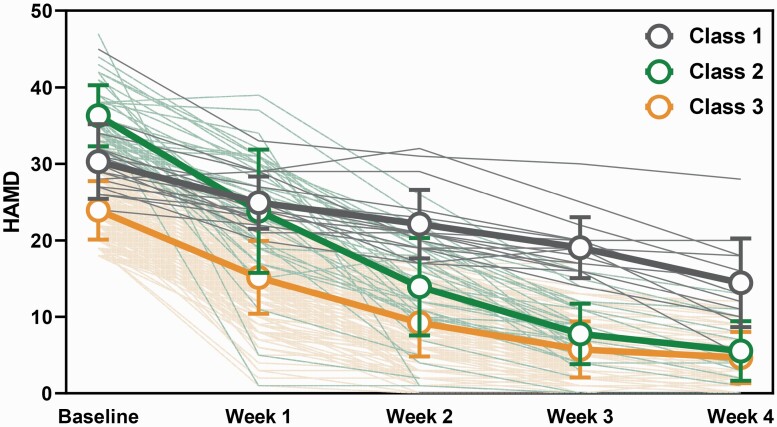
Figure 1.
Trajectories of major depressive disorder (MDD) patients receiving electroconvulsive therapy (ECT) treatment identified by growth mixture modeling (GMM). The orange line represents the slow-response group; the green line represents the rapid-response group; and the grey line represents the non-remit group.

