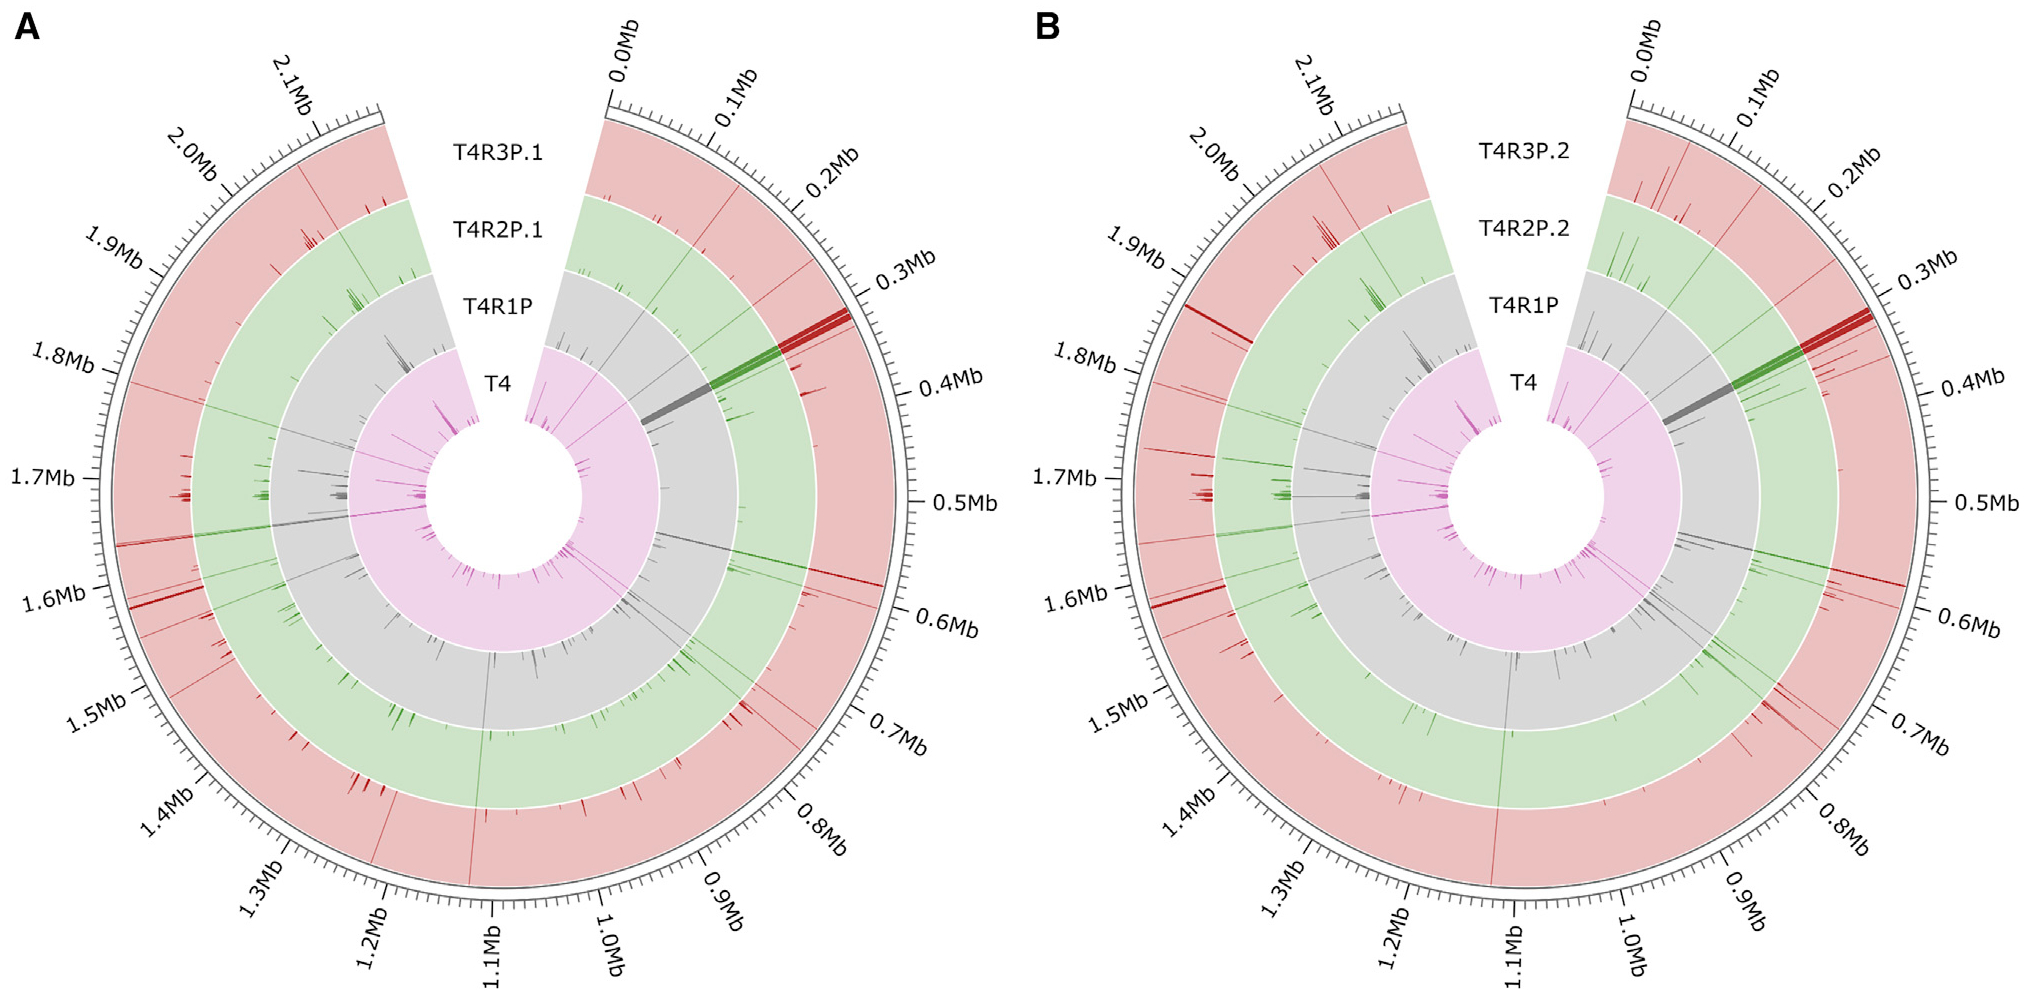
Figure 3. Recombinant pneumococcal isolates show large regional genomic changes.

Maps of genomic changes present in the T4 parental strain (A) and the recombinant series T4R1P, T4R2P.1, and T4R3P.1 (B). The T4 and recombinant series T4R1P, T4R2P.2, and T4R3P.2 were compared with the reference strain TIGR4 (NCBI: NC_003028.3). Strains are denoted by the colored rings. SNPs are illustrated by dark lines, with frequency denoted by length of the line across the width of the ring (i.e., SNPs present in 100% of the sequenced population are depicted as lines spanning the width of each respective ring). Position along the pneumococcal genome is circumscribed on the outer edge of each figure.
