
Figure 3:
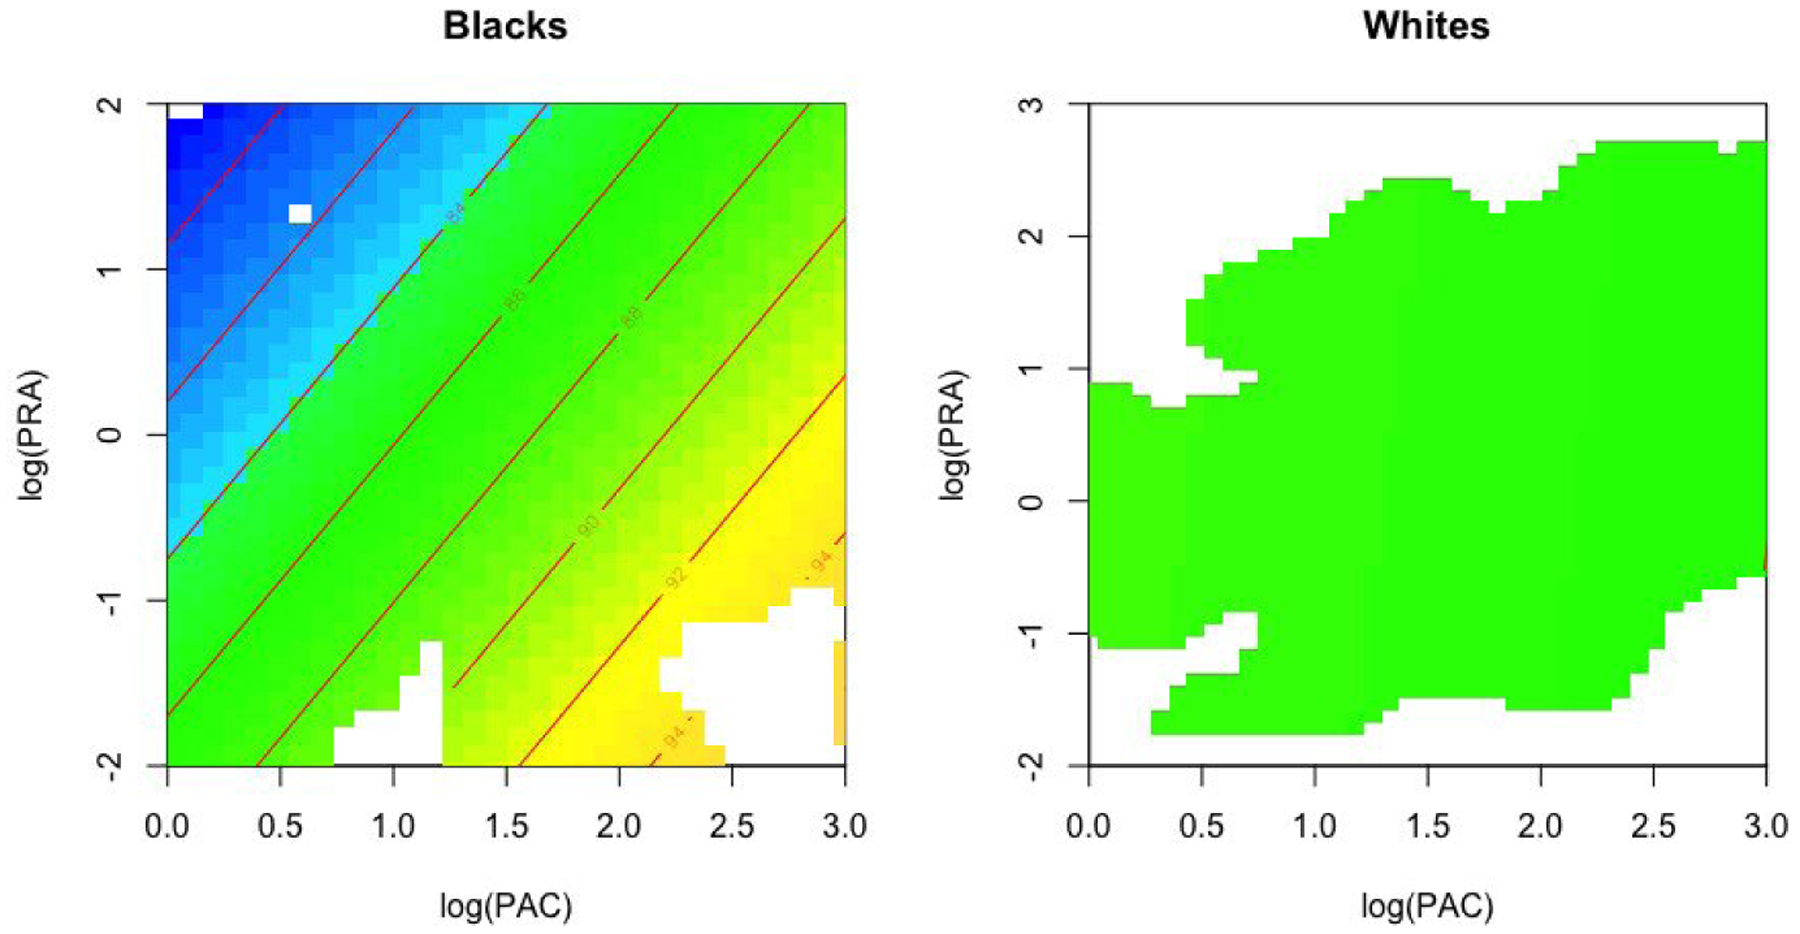
Estimated contour plots of systolic blood pressure as a function of logarithmic transformed plasma renin activity (PRA) and plasma aldosterone concentration (PAC), by race
Official websites use .gov
A
.gov website belongs to an official
government organization in the United States.
Secure .gov websites use HTTPS
A lock (
) or https:// means you've safely
connected to the .gov website. Share sensitive
information only on official, secure websites.
Estimated contour plots of systolic blood pressure as a function of logarithmic transformed plasma renin activity (PRA) and plasma aldosterone concentration (PAC), by race