
Figure 3.
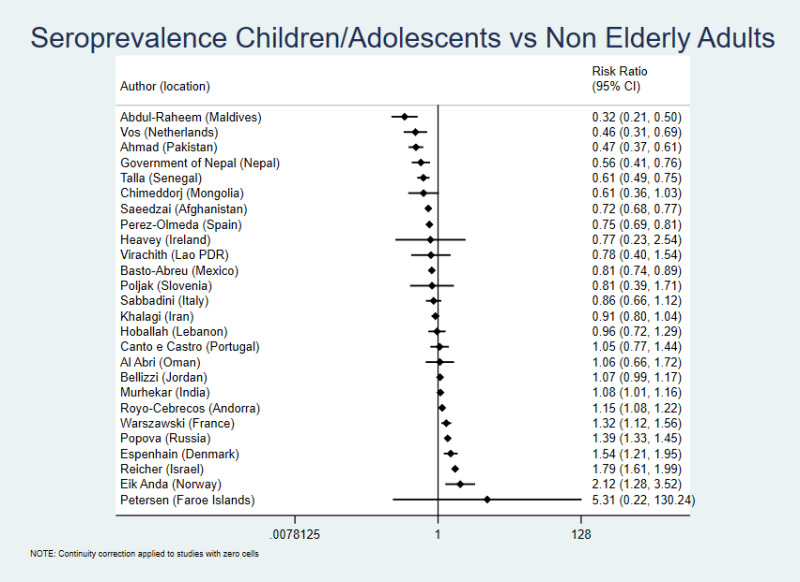
Seroprevalence ratio for pediatric populations vs non-elderly adults. The definitions of age groups are detailed in the “Methods” section. We estimated the presented 95% CIs using crude counts in a two by two table for each study ((number of pediatric population positive/number of pediatric population tested)/(number of non-elderly adults positive/number of non-elderly adults tested)). When only adjusted seroprevalence estimates were available without crude data, these were converted to equivalent of number positive (number positive = adjusted seroprevalence × number tested in the specific age group).