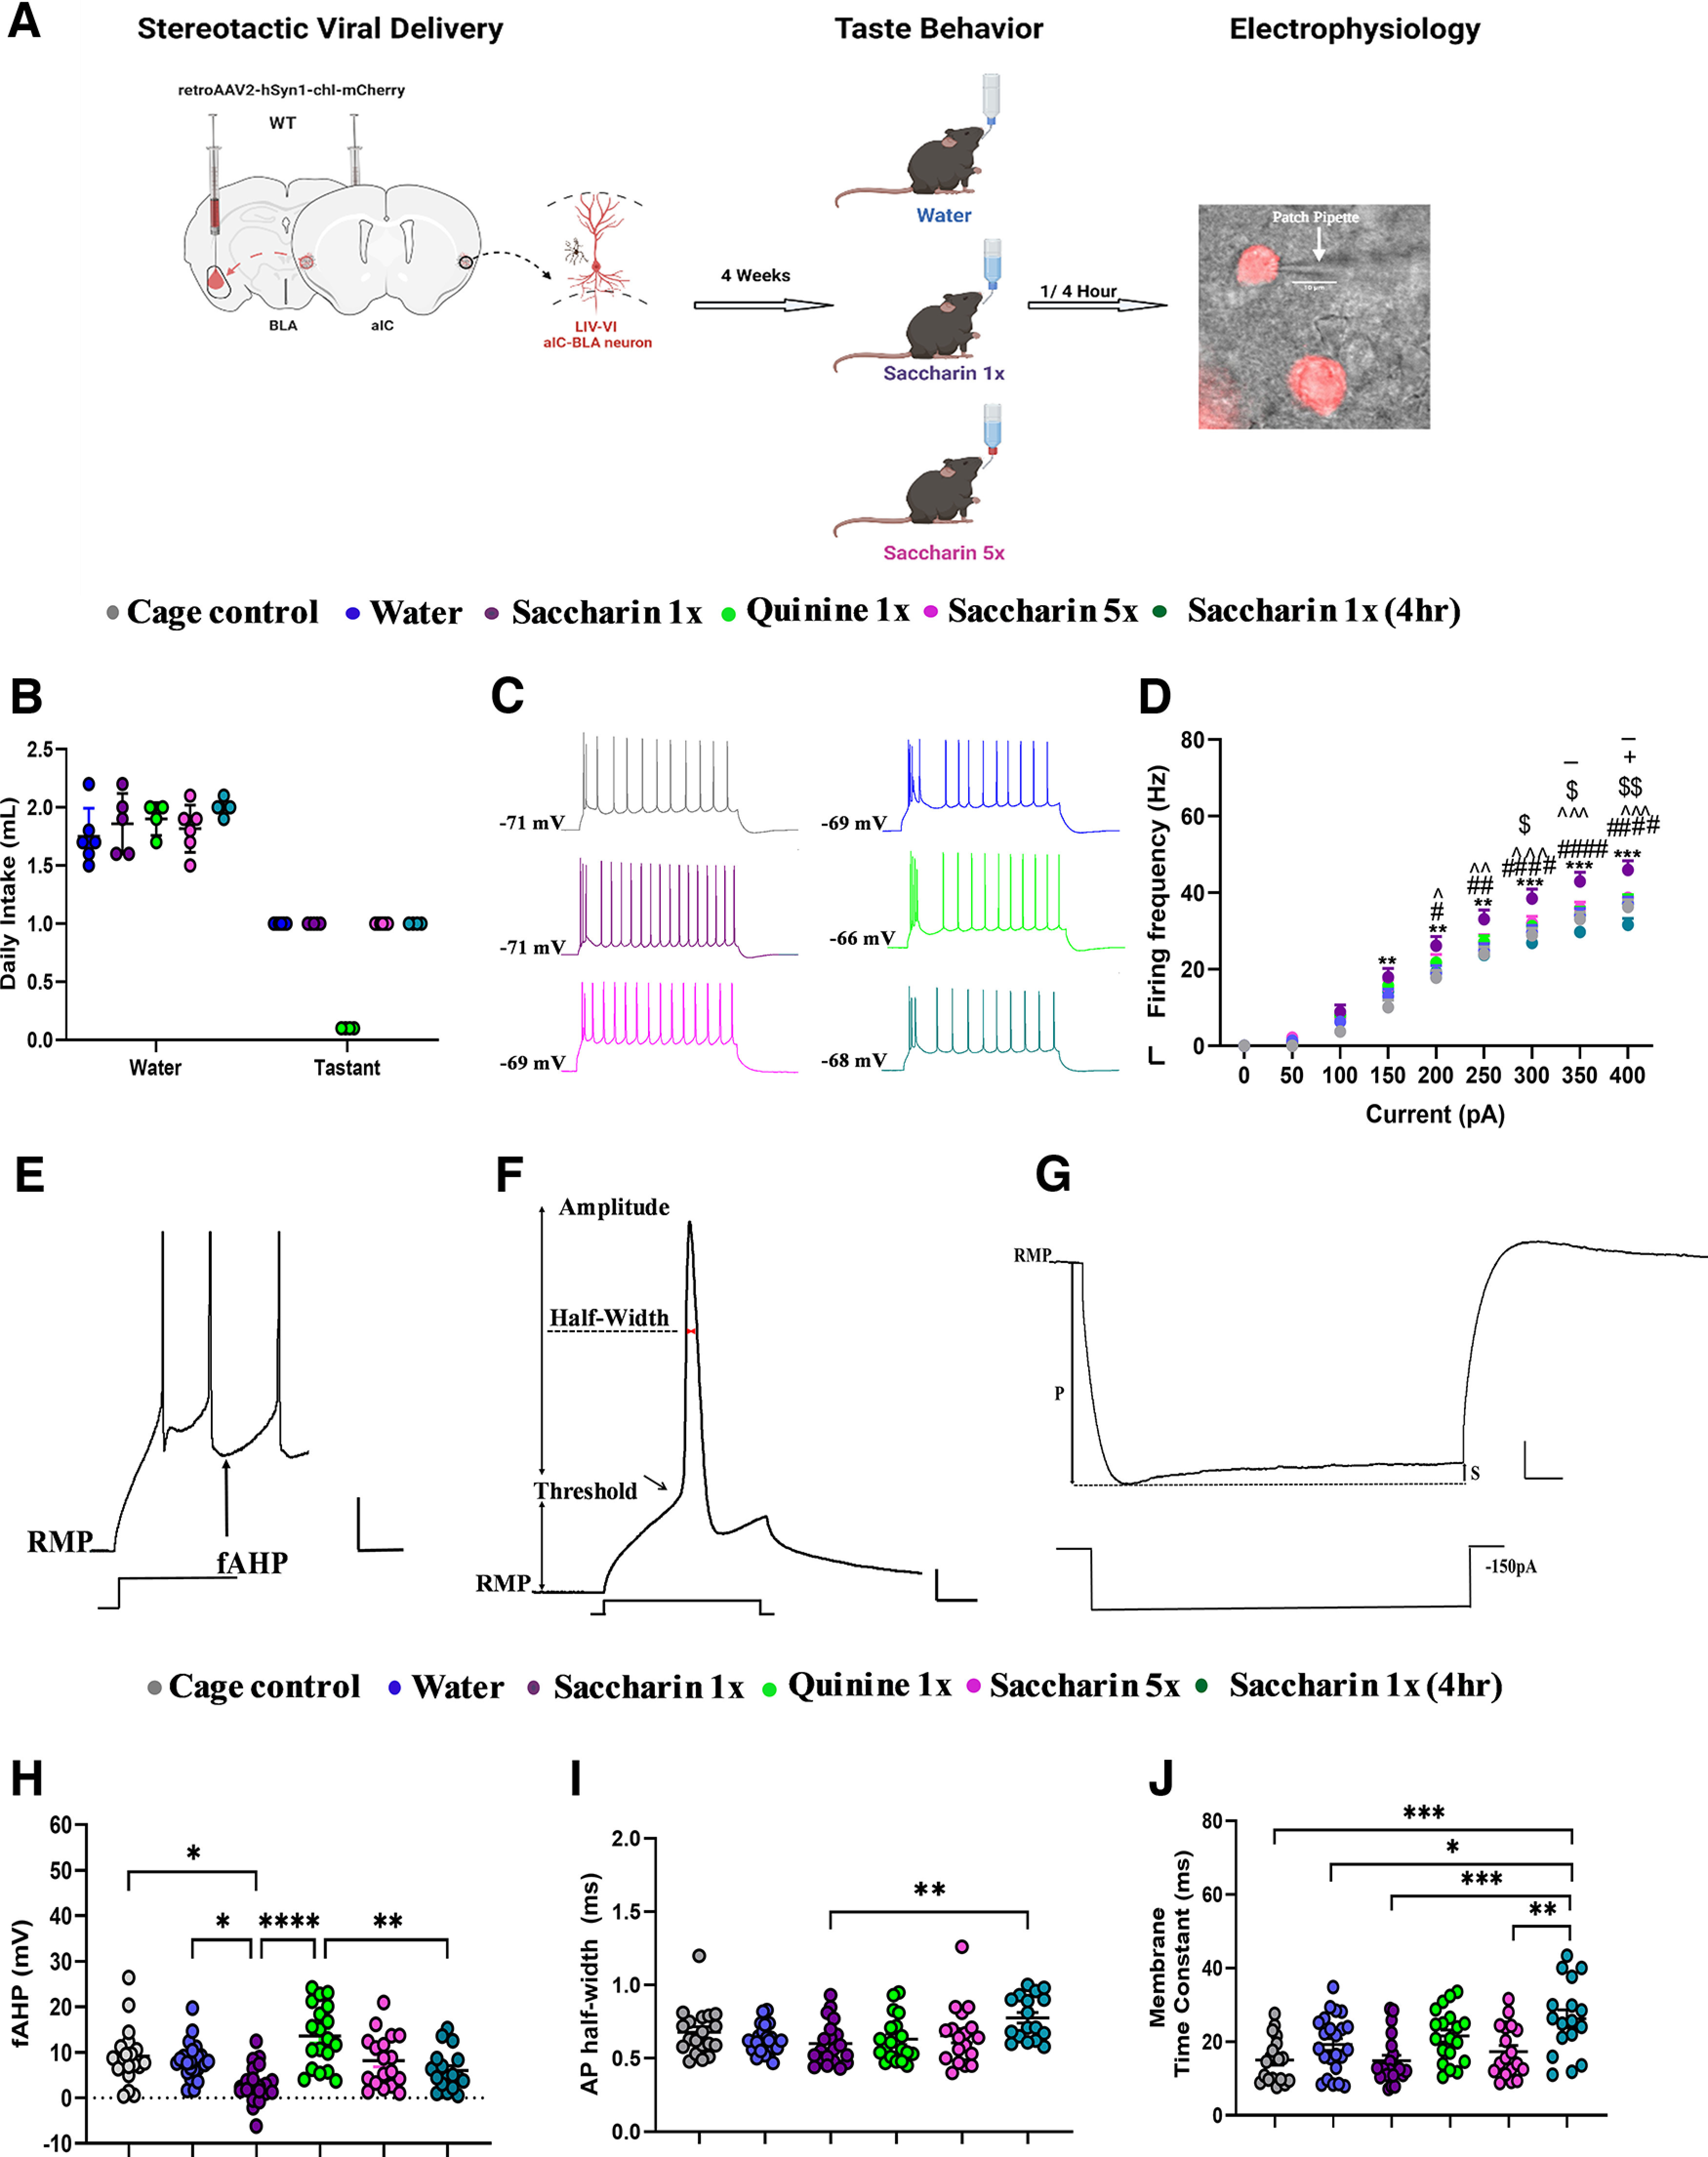
Figure 1.

Retrieval of appetitive and novel taste increases excitability in LIV–VI aIC-BLA projection neurons. A, Diagrammatic representation of experimental procedures. Following surgery and stereotaxic delivery of ssAAV_retro2-hSyn1-chi-mCherry-WPRE-SV40p(A) into the BLA, mice were allowed four weeks of recovery. Animals were subsequently assigned to treatment groups and trained to drink from pipettes (see Materials and Methods). We compared the intrinsic properties of LIV–VI aIC-BLA neurons among the Water (n = 6 animals, 23 cells), Saccharin 1x (n = 5 animals, 20 cells), Saccharin 1x (4 h) (n = 4 animals, 17 cells), Saccharin 5x (n = 6 animals, 18 cells), and Quinine 1x groups (n = 4 animals, 19 cells), as well as a Cage Control group (n = 4 animals, 19 cells) that underwent surgery and stereotaxic delivery of ssAAV_retro2-hSyn1-chi-mCherry-WPRE-SV40p(A) at the BLA without water restriction. B, Graph showing the water consumption before treatment (mean ± SD). There was no significant difference between water intakes between the groups before the treatment. One-way ANOVA, p = 0.9766. C, Representative traces of LIV–VI aIC-BLA projecting neurons from the six treatment groups. Scale bars: 20 mV vertical and 50 ms horizontal from 300-pA step. D, The dependence of firing rate on current step magnitude in LIV–VI aIC-BLA neurons was significantly different among the treatment groups. Excitability in the Saccharin 1x was increased compared with all other groups. Two-way repeated measures ANOVA, Current × Treatment: p < 0.0001; Cage Control versus Saccharin 1x: **p < 0.01, ***p < 0.001; Saccharin 1x versus Saccharin 1x (4 h): #p < 0.05, ##p < 0.01, ####p < 0.0001; Water versus Saccharin 1x: ^p < 0.05, ^̂p < 0.01, ^̂̂p < 0.001; Saccharin 1x versus Quinine 1x: $p < 0.05, $$p < 0.01; Saccharin 1x versus Saccharin 5x: -p < 0.05; Saccharin 1x (4 h) versus Saccharin 5x: +p < 0.05. E, Representative of all fAHP measurements in response to 500-ms step current injections. Scale bars: 20 mV vertical and 50 ms horizontal. F, Representative of all action potential properties were taken. Scale bars: 20 mV vertical and 5 ms horizontal. G, Measurements for all input resistance, sag ratio, and membrane time constants were analyzed in response to 1-s, −150-pA step current injection. P, peak voltage; S, steady state voltage. Scale bars: 5 mV vertical and 100 ms horizontal. H, Significant differences were observed among the treatment groups in terms of fAHP. Cage Control (9.191 ± 1.449 mV), Water (8.150 ± 0.8288 mV), Saccharin 1x (3.016 ± 0.9423 mV), Quinine 1x (13.58 ± 1.562 mV), Saccharin 5x (8.158 ± 1.356 mV), Saccharin 1x (4 h) (5.989 ± 1.074 mV), one-way ANOVA, p < 0.0001. I, Action potential half-width in the Saccharin 1x group (0.6005 ± 0.03260 ms) was significantly decreased compared with Saccharin 1x (4 h) (0.7765 ± 0.03641 ms), one-way ANOVA, p = 0.0065. J, The membrane time constant was significantly different between the Cage Control (15.03 ± 1.376 ms) and Saccharin 1x (4 h) (26.21 ± 2.421 ms), Water (19.24 ± 1.620 ms) and Saccharin 1x (4 h) (26.21 ± 2.421 ms), Saccharin 1x (14.82 ± 1.485 ms) and Saccharin 1x (4 h) (26.21 ± 2.421 ms), and Saccharin 5x (17.30 ± 1.660 ms) and Saccharin 1x (4 h) (26.21 ± 2.421 ms) groups. One-way ANOVA, p < 0.0001. For panels D, H–J: *p < 0.05, **p < 0.01, ***p < 0.001, ****p < 0.0001. All data are shown as mean ± SEM. Histologic verification of viral delivery at the IC and BLA, as well as locations of whole-cell patch-clamp recording electrode (see Extended Data Fig. 1-1). Individual IC neurons were classified as burst-spiking and regular-spiking by post hoc analysis of responses to rheobase current injections (see Extended Data Fig. 1-2). The intrinsic properties of burst spiking LIV–VI aIC-BLA projecting neurons are differentially modulated by taste valence in the context of novelty (see Extended Data Fig. 1-3).
