
Fig. 6.
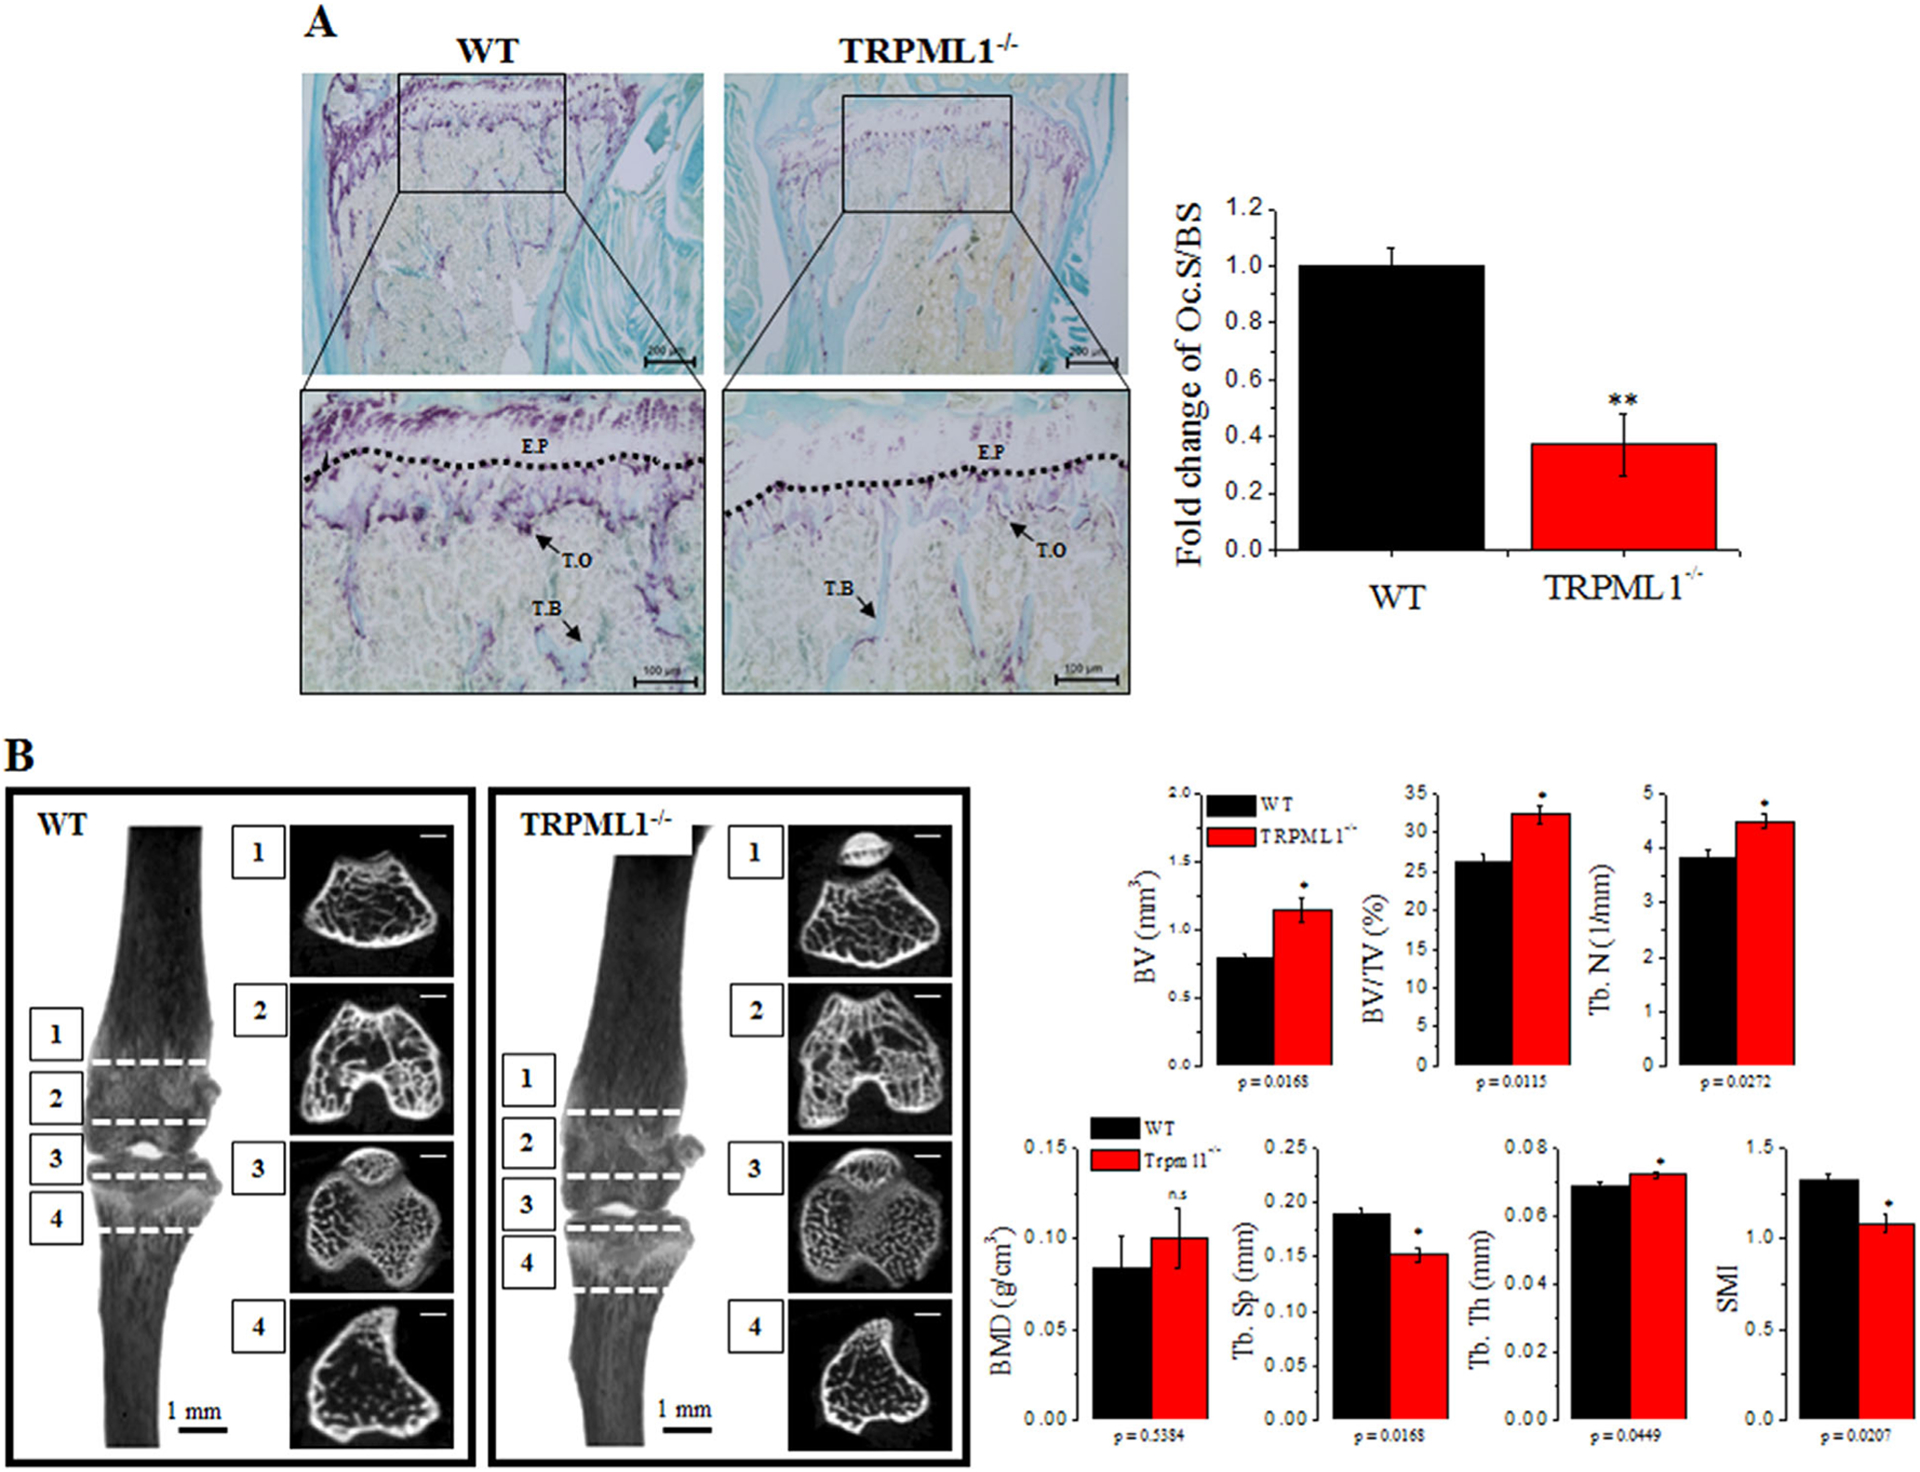
Pathological osteoclast function and bone remodeling in TRPML1−/− mice. For the in vivo experiments, proximal femoral bones and tibias were isolated from WT and TRPML1−/− mice and used for histological analysis and μCT. (A) Bone sections were stained for TRAP. The Oc.S/BS (%) was analyzed, and results are presented as fold change relative to WT. (Scale bar = 100 μm). Dashed line demarcates the E.P. (B) μCT images of proximal femur obtained from WT and TRPML1−/− mice. Each parameter, including BV, BV/TV, BMD, Tb.N, Tb.Th, Tb.Sp, and SMI were calculated and are presented. *p < 0.05, **p < 0.01. (Scale bar = 500 μm). Oc.S/BS = osteoclast surface; E.P = epiphyseal plate; T.O = TRAP+ osteoclasts; T.B = trabecular bone; BV = bone volume; BV/TV = bone volume per tissue volume; BMD = bone mineral density; Tb.N = trabecular number; Tb.Th = trabecular thickness; Tb.Sp = trabecular separation; SMI = structure model index.