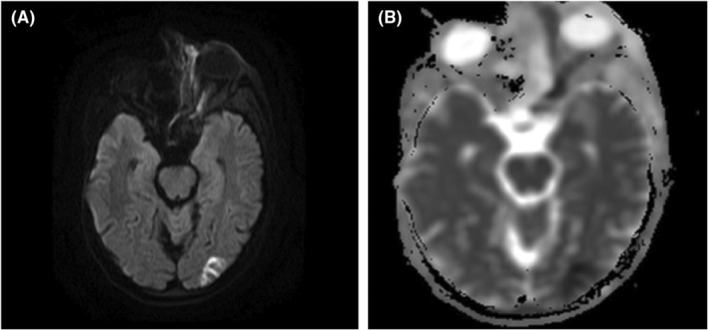
FIGURE 2.

(A, B) Diffusion‐weighted imaging (DWI). (A) shows hyperintense signals within the left optic nerve, which correlates with hypointense signals on apparent diffusion coefficient (ADC) mapping (B), suggesting diffusion restriction consistent with optic nerve infarction. Further diffusion restriction is seen in the left occipital lobe suggesting an intracranial extension of the disease process.
