. 2022 Jul 29;15(3):1145–1153. doi: 10.1039/d2nr02350d

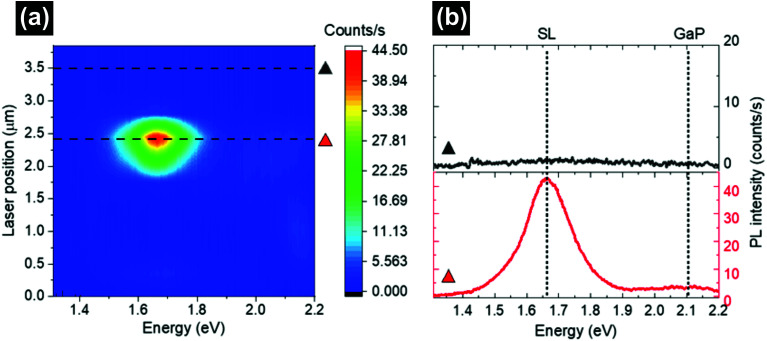
Fig. 5. (a) False color μ-PL map collected at room temperature and a power density of 13 kW cm−2 on the same NW investigated by Raman spectroscopy. The NW starts at 0 μm with a laser centered on the NW bottom (see the sketch in Fig. 2a) and ends at the NW tip at ∼3.8 μm. Due to the absence of a significant signal outside the SL region, the first and last points of the map were collected with a laser fully positioned on the NW and not partially positioned on it as in the Raman map. This results in a PL map that is 700 nm shorter than the Raman map. The PL signal is detected only in the correspondence of the SL region. Dashed lines indicate the two NW positions from which the spectra shown in panel (b) are extracted. (b) Two selected spectra from (a), as indicated by the triangles. The spectra come from the SL segment (bottom, red triangle) and from the top GaP segment (top, black triangle). Dotted lines mark the center of mass of the two main spectral contributions: the SL band and the weak GaP-related band.

Fig. 5