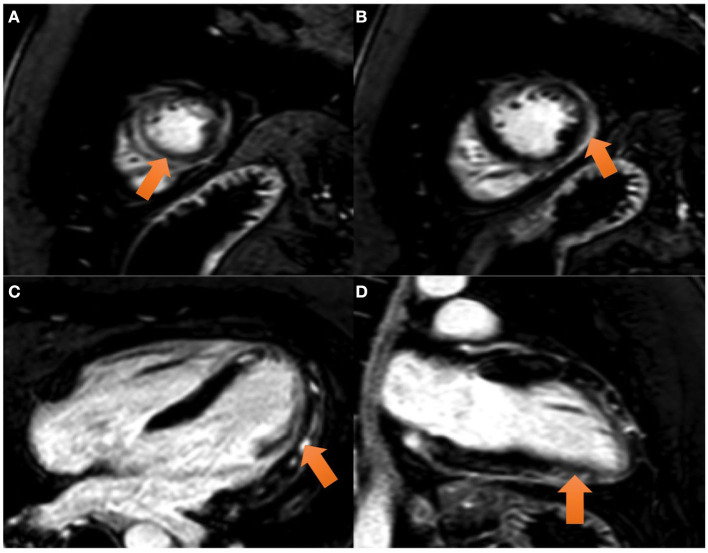
Figure 3.
CMR images: (A) T2 STIR sequence: a high ratio (> 2) is seen in the intensity between the myocardium and the skeletal muscle compatible with a generalized edema. Color-coded image of T2 mapping in LV mid-chamber. The arrow marks an increased T2 value (T2 = 60 ms) in the lateral and inferolateral wall. (B) Color-coded image of T2 mapping in LV mid-chamber. The arrow marks an increased T2 value (T2 = 60 ms) in the lateral and inferolateral wall. (C, D) T1 mapping and T1 enhanced mapping, respectively. In T1 mapping, extensive area of increased T1 value (view pink and orange areas) in lateral and inferolateral walls. On quantitative analysis, values on the native T1 map were 1,160 ms (normal value 1,025–1,075 ms). In T1 enhanced mapping, these areas area correlated with increased extracellular volume (ECV).

