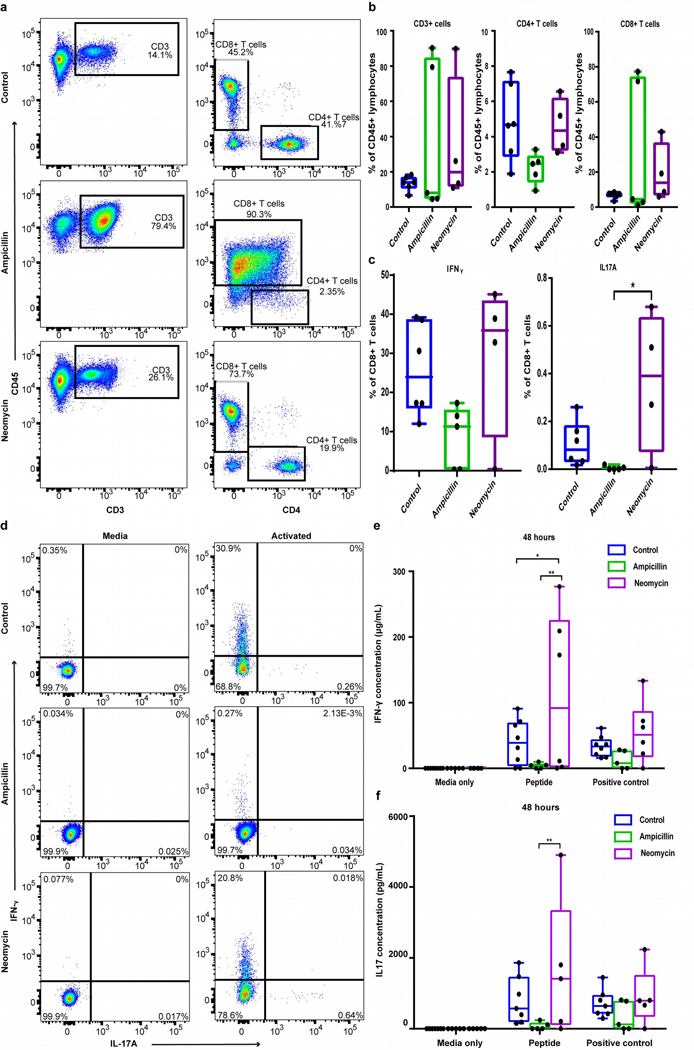
Fig. 6. Antibiotic treatment skews T-cell distribution and functionality.
(a) Example FACS plots and (b) bar graphs of total T cells, CD4+ and CD8+ T cells among CD45+ splenocytes. (c) IFN-γ and IL-17A were measured in CD8+ T cells from antibiotic-treated or control mice after 5 hrs incubation with or without leukocyte activation cocktail (LAC). (d) IFN-γ and IL-17A+ cells in live CD8+ T cells among LAC or media-treated controls cells. (e) IFN-γ and (f) IL-17 were measured by ELISA in splenocyte supernatants from antibiotic-treated and control mice stimulated with media, Tyrosinase369–377 (30μg/ml) or CD3/CD28 activator beads for 48 hrs. (*p<0.05, **p<0.01).

