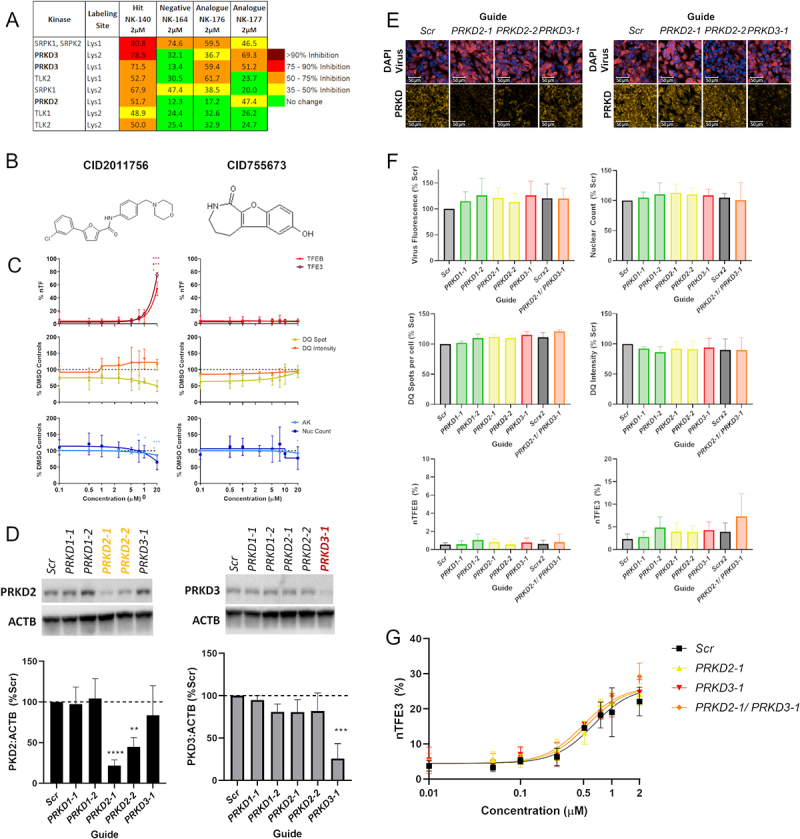
Figure 5.

Quinazoline analog series activity is independent of PRKD. (A) The top results from the KiNativ in-cell kinase binding activity, highlight specific binding to PRKD2 and PRKD3. (B) Structures of commercially available protein kinase D inhibitors CID2011756 and CID755673. (C) %nTF indicates the percentage of nuclear TFEB and TFE3 translocation, DQ Red BSA degradation and AK and nuclear count for toxicity were measured in SH-SY5Y cells after exposure to increasing concentrations of CID2011756 and CID755673 compounds for 24 h. CID2011756 shows some TFEB and TFE3 translocation only at 20 µM where there is also some reduction of DQ Red BSA signal and toxicity. CID755673 shows no TFEB and TFE3 translocation, alteration in DQ Red BSA signal or toxicity. (D) Using CRISPRi, PRKD2 and PRKD3 were knocked down to ~21 and 25% of basal levels, respectively, as measured by western blotting. (E) sgRNA guides were co-expressed with iRFP670, allowing visualization of vector transduction alongside PRKD2 and PRKD3 knockdown using immunocytochemistry. Scale bars: 50 µm. (F) Guide fluorescence, nuclear count, DQ Red BSA active spot count and correct fluorescent intensity and TFEB and TFE3 translocation showed no differences between targeting guides and appropriate Scr controls. (G) Cells treated with Scr or PRKD2 or PRKD3 targeting guides were exposed to increasing concentrations of NK140 compound; however, demonstrated no increased activity in the TFE3 translocation assay (n = 3 biological replicates, error bars = s.d). n = 3 for all above assays, mean ± s.d. *p < 0.05, **p < 0.01, *** p < 0.001, **** p < 0.0001 One-way ANOVA with Dunnett’s multiple comparisons test.
