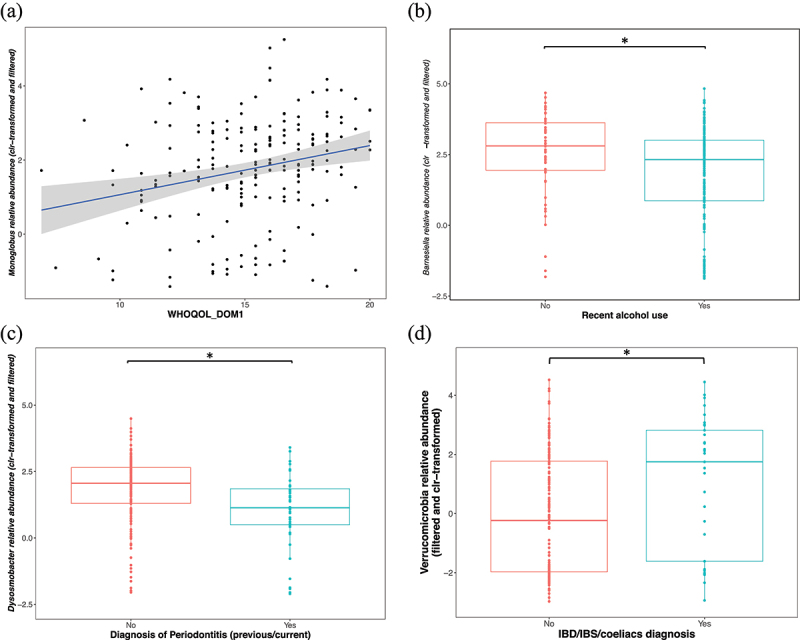
Figure 7.

(a) Positive correlation between Monoglobus abundance and WHOQOL domain 1 scores (Spearman rs = 0.26; GLM p = 0.01, n = 198). (b) Negative associations between recent alcohol use and the relative abundance of Barnesiella (mdn = 2.32 versus mdn = 2.8) (GLM, p = 0.03, r = 0.2, n = 198), and (c) between periodontitis diagnosis (current and/or previous) and the relative abundances of Dysosmobacter (mdn = 1.13 versus mdn = 2.06) (GLM, p = 0.002, r = 0.3, n = 198). (d) Lower relative abundance of Verrucomicrobia in individuals with a current/prior diagnosis of IBD/IBS/CeD (mdn = 1.75 versus mdn = 0.23) (GLM, p = 0.03, r = 0.2, n = 198). Y-axes show the clr-transformed relative abundances of the taxa. The solid line indicates the median, lower and upper bounds of boxes indicate the first and third quartiles, respectively; whiskers indicate the 1.5 interquartile range IQR beyond the upper and lower quartiles. Dots represent individual data points. Sample sizes: Alcohol intake YES n = 146, Alcohol intake NO n = 52, Periodontitis diagnosis YES n = 44, Periodontitis diagnosis NO n = 154. IBD/IBS/CeD YES n = 33, IBD/IBS/CeD NO n = 165. Significance * for p ≤ 0.05. Celiac disease – CeD, inflammatory bowel disease – IBD, irritable bowel syndrome – IBS, World Health Organization Quality Of Life scores for domain 1 (physical health) – WHOQOL_DOM1.
