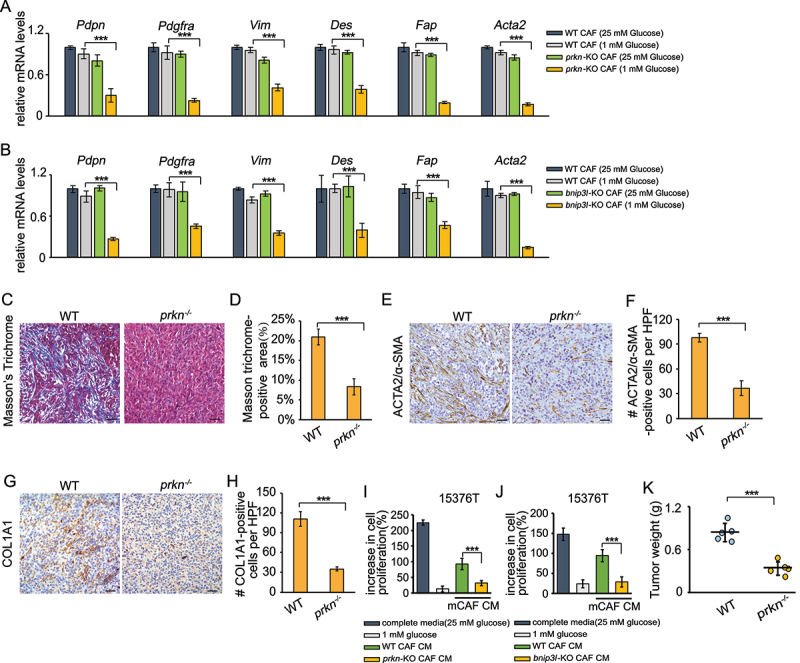
Figure 5.

Mitophagy is required to maintain the CAFs phenotype. (a) WT CAFs and prkn-KO CAFs were cultured in complete media (25 mM glucose) or low glucose media (1 mM glucose) for 24 h. RNA was then extracted and RT-PCR was performed to analyze analyzed the mRNA level of Pdpn, Pdgfra, Vim, Des, Fap, and Acta2. (b) WT CAFs and bnip3l-KO CAFs were cultured in complete media (25 mM glucose) or low glucose media (1 mM glucose) for 24 h. RNA was then extracted and RT-PCR was performed to analyze analyzed the mRNA level of Pdpn, Pdgfra, Vim, Des, Fap, and Acta2. (c and d) Masson’s trichrome staining in the tumor sections from WT and prkn−/− mice after orthotopically implantation of 15,376 T cells (c). Quantification of Masson trichrome-positive area in WT and prkn−/− mice (d). (e and f) ACTA2/α-SMA immunohistochemical staining in the tumor sections from WT and prkn−/− mice after orthotopically implantation of 15,376 T cells. Representative images from n = 5 mice per group are illustrated (E). Quantification of ACTA2/α-SMA-positive cells in WT and prkn−/− mice (F). HFP = 40x field, n = 15 fields from 5 mice. (g and h) COL1A1 immunohistochemical staining in the tumor sections from WT and prkn−/− mice after orthotopically implantation of 15,376 T cells. Representative images from n = 5 mice per group are illustrated (g). Quantification of COL1A1-positive cells in WT and prkn−/− mice (h). HFP = 40x field, n = 15 fields from 5 mice. (i) 15,376 T was cultured in conditioned medium (1 mM glucose) from WT CAFs and nadk2-KO CAFs for 24 h. The cells were counted to calculate the cell proliferation. (j) 15,376 T was cultured in conditioned medium (1 mM glucose) from WT CAFs and aldh18a1/p5cs-KO CAFs for 24 h. The cells were counted to calculate the cell proliferation. (k) 15,376 T cells were orthotopically injected into WT and prkn−/− mice. After 10 days, the tumors were weighed.
