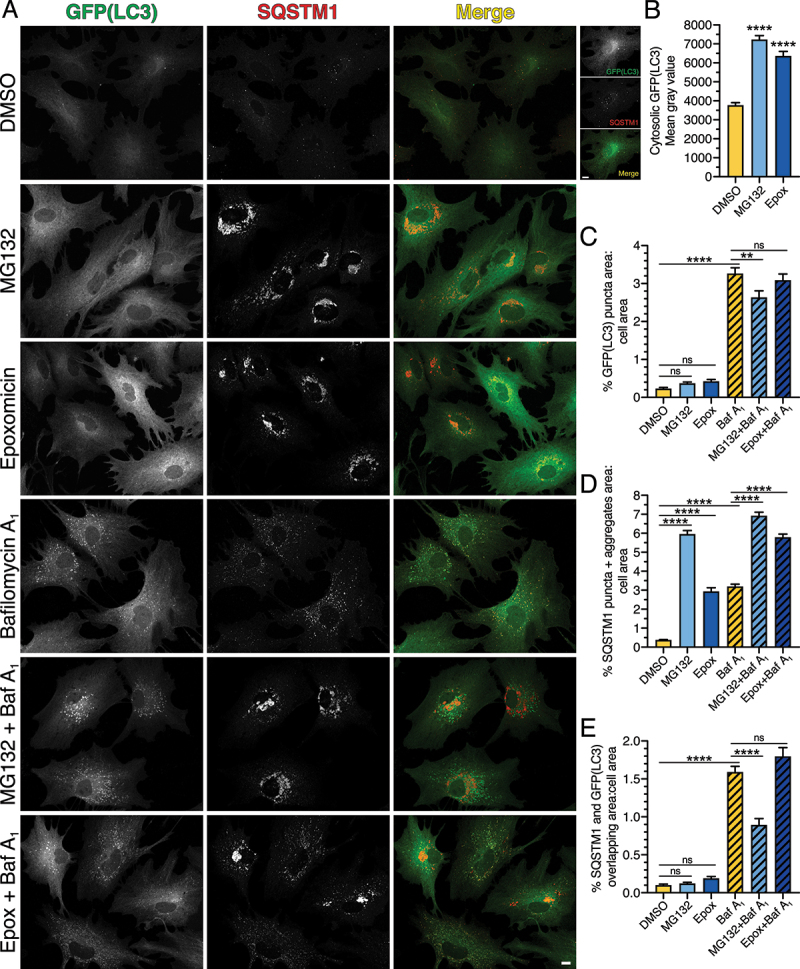
Figure 4.

Long-term UPS inhibition does not significantly upregulate autophagic flux, but leads to the formation of SQSTM1-positive aggresomes in primary astrocytes. (A-E) Immunostain analysis and corresponding quantification of primary astrocytes treated with DMSO, 0.5 µM MG132 or 10 nM epoxomicin for 24 h; 100 nM Baf A1 (or equivalent volume of DMSO as a solvent control) was included in the last 4 h. (A) Maximum projections of z-stacks of GFP-LC3 transgenic astrocytes immunostained for GFP and SQSTM1. GFP(LC3) images for DMSO, MG132, and Epoxomicin are grayscale matched to show an increase in cytosolic LC3 upon UPS inhibition. Higher magnification images for DMSO are contrast enhanced for visualization. Bars: 10 µm. (B) Quantification of cytosolic GFP(LC3) signal intensity (means ± SEM; one-way ANOVA with Tukey’s post hoc test; n = 143–182 cells from 3 independent experiments; 6–7 DIV). (C) Quantification of total GFP(LC3) puncta area normalized to cell area (means ± SEM; one-way ANOVA with Tukey’s post hoc test; n = 78–102 cells from 3 independent experiments; 6–7 DIV). (D) Quantification of total area occupied by SQSTM1-positive structures (puncta and aggresomes) normalized to cell area (means ± SEM; one-way ANOVA with Tukey’s post hoc test; n = 85–108 cells from 3 independent experiments; 6–7 DIV). (E) Quantification of the percentage of overlapping area between GFP(LC3)-positive and SQSTM1-positive structures normalized to cell area (means ± SEM; one-way ANOVA with Tukey’s post hoc test; n = 73–96 cells from 3 independent experiments; 6–7 DIV).
