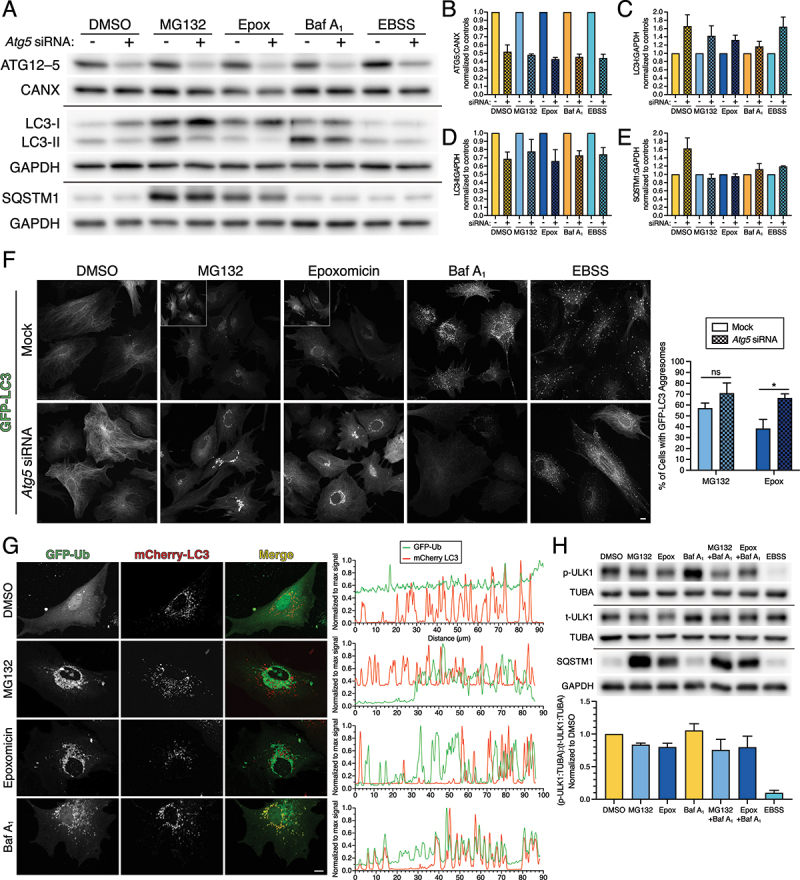
Figure 8.

LC3 population on aggresomes is likely cytosolic LC3 rather than autophagosome-associated LC3. Primary astrocytes were treated with DMSO, 0.5 µM MG132 or 10 nM epoxomicin for 24 h, 100 nM Baf A1 for 4 h, or EBSS for 4 h. (A-F) Astrocytes were also treated with siRNAs targeted against Atg5, or a mock treatment as a control. (A-E) Immunoblot analysis and corresponding quantification of glial lysates. CANX and GAPDH serve as loading controls; horizontal lines designate individual blots. (B) ATG5 levels (specifically in the context of the ATG12-ATG5 conjugate) were normalized to CANX; (C and D) LC3-I and LC3-II were normalized to GAPDH; and (E) SQSTM1 levels were normalized to GAPDH (means ± SEM; n = 3 independent experiments; 6 DIV). (F) Maximum projections of z-stacks of GFP-LC3 transgenic astrocytes using live cell imaging. Images within the same column of treatment (e.g. DMSO mock and DMSO siRNA) are grayscale matched to facilitate direct comparisons; insets are grayscale adjusted individually. Bar: 10 µm. Corresponding quantification of the percentage of astrocytes with GFP-LC3-positive aggresomes (means ± SEM; unpaired t-test; n = 4 independent experiments; 6–7 DIV). (G) Primary astrocytes were treated with DMSO, 0.5 µM MG132 or 10 nM epoxomicin for 24 h, or 100 nM Baf A1 for 4 h and analyzed using live cell imaging. Shown are maximum projections of z-stacks of astrocytes expressing mCherry-LC3 and GFP-Ub (shown are representative images from 3 independent experiments; 6 DIV). Bar: 10 µm. Corresponding line scans are drawn from the cell periphery toward the perinuclear region (left to right). Overlapping peaks for mCherry-LC3 and GFP-Ub are present in the basal conditions (DMSO and Baf A1). mCherry-LC3 and GFP-Ub are largely non-overlapping in treatments that block UPS function (MG132 and epoxomicin). (H) Primary astrocytes were treated with DMSO, 0.5 µM MG132 or 10 nM epoxomicin for 24 h; DMSO or 100 nM Baf A1 were included in the final 4 h. As a positive control, astrocytes were also starved in EBSS for 4 h. Immunoblot analysis and corresponding quantification of of glial lysates. TUBA/α-tubulin and GAPDH serve as loading controls; horizontal lines designate individual blots. p-ULK1 (S757) and total ULK1 (t-ULK1) levels were first normalized to their respective TUBA/α-tubulin controls, and then p-ULK1:TUBA/α-tub was then normalized to t-ULK1:TUBA/α-tub (means ± SEM; n = 3 independent experiments; 6–7 DIV).
