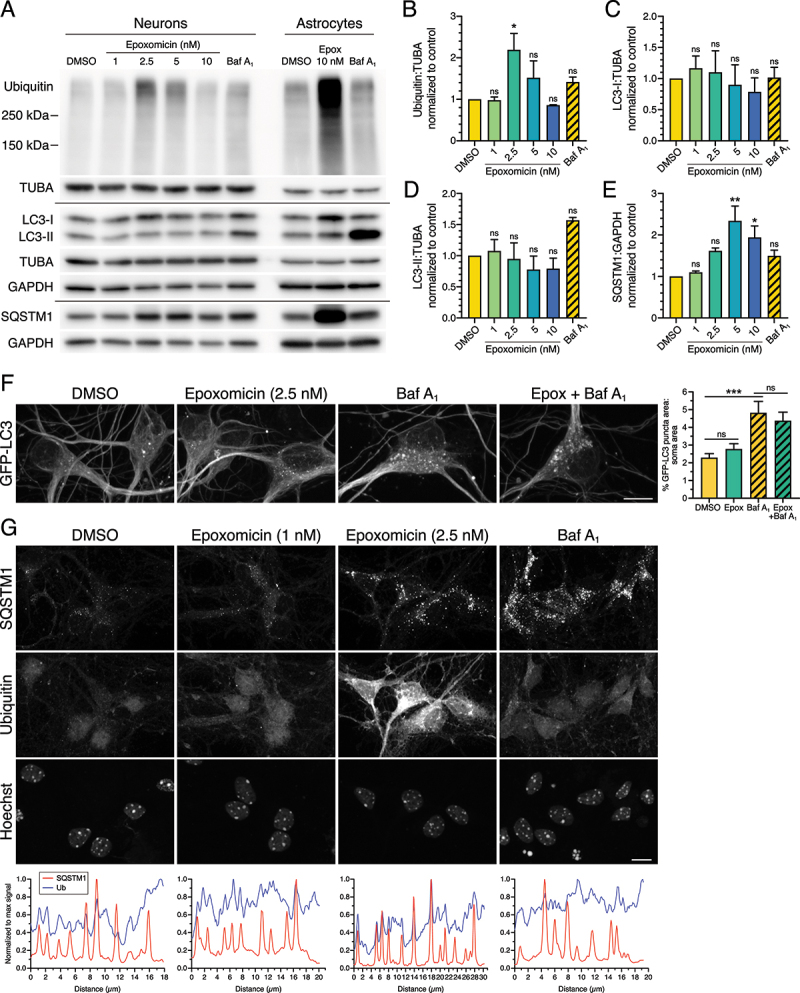
Figure 9.

UPS inhibition has a reduced effect on SQSTM1 aggresome formation in primary cortical neurons. (A-E) Immunoblot analysis and corresponding quantification of increasing concentrations of epoxomicin (24-h treatment) as compared with 100 nM Baf A1 for 4 h in primary mouse cortical neurons. Astrocytes were treated with 10 nM epoxomicin for 24 h or 100 nM Baf A1 for 4 h; 3 DIV. GAPDH and TUBA/α-tubulin serve as loading controls; horizontal lines designate individual blots. ubiquitin, LC3-I, and LC3-II levels were normalized to TUBA/α-tubulin, and SQSTM1 levels were normalized to GAPDH (means ± SEM; one-way ANOVA with Dunnett’s post hoc test; n = 3 independent experiments; 8 DIV). Differences in Ub and SQSTM1 levels in the dosage response at 5 nM epoxomicin may reflect issues with toxicity and normalization to GAPDH. (F) Maximum projections of z-stacks of GFP-LC3 transgenic mouse cortical neurons using live cell imaging. Neurons were treated with 2.5 nM epoxomicin for 24 h; 100 nM Baf A1 (or equivalent volume of DMSO as a solvent control) was included in the last 4 h. Bar: 10 µm. Corresponding quantification of total GFP-LC3 puncta area normalized to soma area (means ± SEM; one-way ANOVA with Tukey’s post hoc test; n = 53–64 neurons from 3 independent experiments; 7 DIV). (G) Immunostain and corresponding line scan analysis of primary mouse cortical neurons (7 DIV) treated with DMSO, 1 nM or 2.5 nM epoxomicin for 24 h, or 100 nM Baf A1 for 4 h. Images with the same marker (SQSTM1, Ub, or Hoechst) are grayscale matched to facilitate direct comparisons across treatments. Bar: 10 µm.
