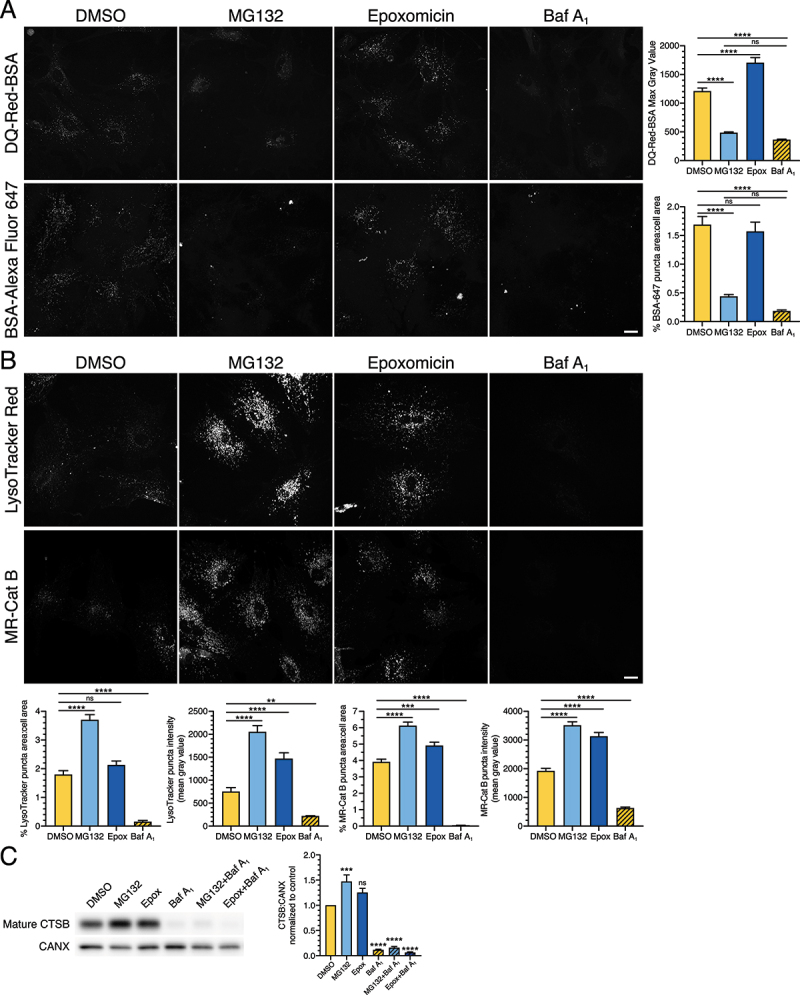
Figure 10.

Long-term UPS inhibition stimulates lysosome function in astrocytes. (A and B) Live-cell imaging analysis of primary astrocytes treated with DMSO, 0.5 µM MG132 or 10 nM epoxomicin for 24 h, or 100 nM Baf A1 for 4 h. All images within the same marker are grayscale matched to facilitate direct comparisons. (A) Maximum projections of z-stacks and corresponding quantification of astrocytes labeled with DQ-Red-BSA or BSA-Alexa Fluor 647 (BSA-647) for the final 1 h of the indicated treatment (means ± SEM; one-way ANOVA with Tukey’s post hoc test; DQ-Red-BSA, n = 95–121 cells from 3 independent experiments; BSA-647, n = 85–96 cells from 3 independent experiments; 5–8 DIV). Bar: 20 µm. (B) Maximum projections of z-stacks and corresponding quantitation of astrocytes labeled with LysoTracker Red or Magic-Red Cathepsin B substrate for the final 30 min of the indicated treatment (means ± SEM; one-way ANOVA with Tukey’s post hoc test; LysoTracker, n = 69–76 cells from 3 independent experiments; MR-Cat B, n = 72–97 cells from 3 independent experiments; 7–10 DIV). Bar: 20 µm. (C) Immunoblot analysis and corresponding quantification of primary astrocytes treated with DMSO, 0.5 µM MG132 or 10 nM epoxomicin for 24 h; 100 nM Baf A1 (or equivalent volume of DMSO as a solvent control) was included in the last 4 h. Mature CTSB levels were normalized to CANX (means ± SEM; one-way ANOVA with Dunnett’s post hoc test; n = 3–4 independent experiments; 6–9 DIV).
