Figure 4.

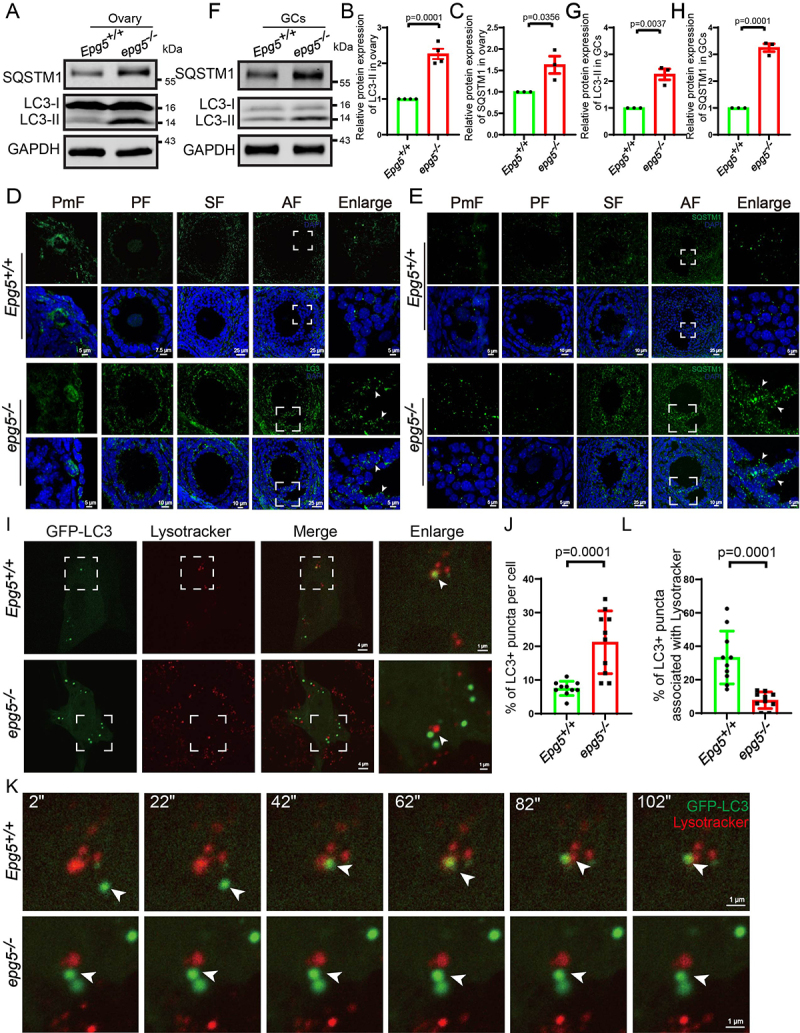
Accumulation of the autophagy maker LC3-II and SQSTM1 aggregates in epg5 knockout mice ovaries. (a) Immunoblotting for the LC3, SQSTM1 protein, and GAPDH (internal control) levels in ovaries. (b-c) Summary of quantification data from LC3 and SQSTM1 activity assays (relative to control). All experiments were repeated at least three times. (d) LC3 aggregates were accumulated dramatically in epg5 knockout GCs compared to the control groups. The white arrow shows LC3 puncta in antral follicular GCs. Scale bars: 5 µm, 7.5 µm, 10 µm, 25 µm. (e) SQSTM1 puncta aggregation was observed in the epg5 knockout GCs compared to the control groups. The white arrow shows SQSTM1 puncta in antral follicular GCs. Scale bars: 5 µm, 10 µm, 25 µm. (f) Immunoblotting for the LC3, SQSTM1 protein, and GAPDH (internal control) levels in GCs. (g-h) Summary of quantification data from LC3 and SQSTM1 activity assays (relative to control) in GCs. (i) GFP-LC3 puncta colocalize with Lysotracker puncta in control but not epg5 knockout GCs. Scale bars: 4 µm, 1 µm. (j) Quantification of the number of GFP-LC3 punctate structures in control and epg5 knockout GCs (n = 10 for each group). (k) In control cells, an LC3 punctum (arrows) originally associates with Lysotracker puncta structures, while in epg5 knockout GCs, an LC3 punctum did not fusion with Lysotracker punctum. Scale bars: 1 µm. (l) The percentage of LC3-stained puncta colocalizing with Lysotracker punctate structures in control and epg5 knockout GCs (n = 10 for each group). All experiments were repeated at least three times. PmF, primordial follicle; PF, primary follicle; SF, secondary follicle; AF, antral follicle. Data are expressed as the mean ± S.E.M.
