Figure 5.

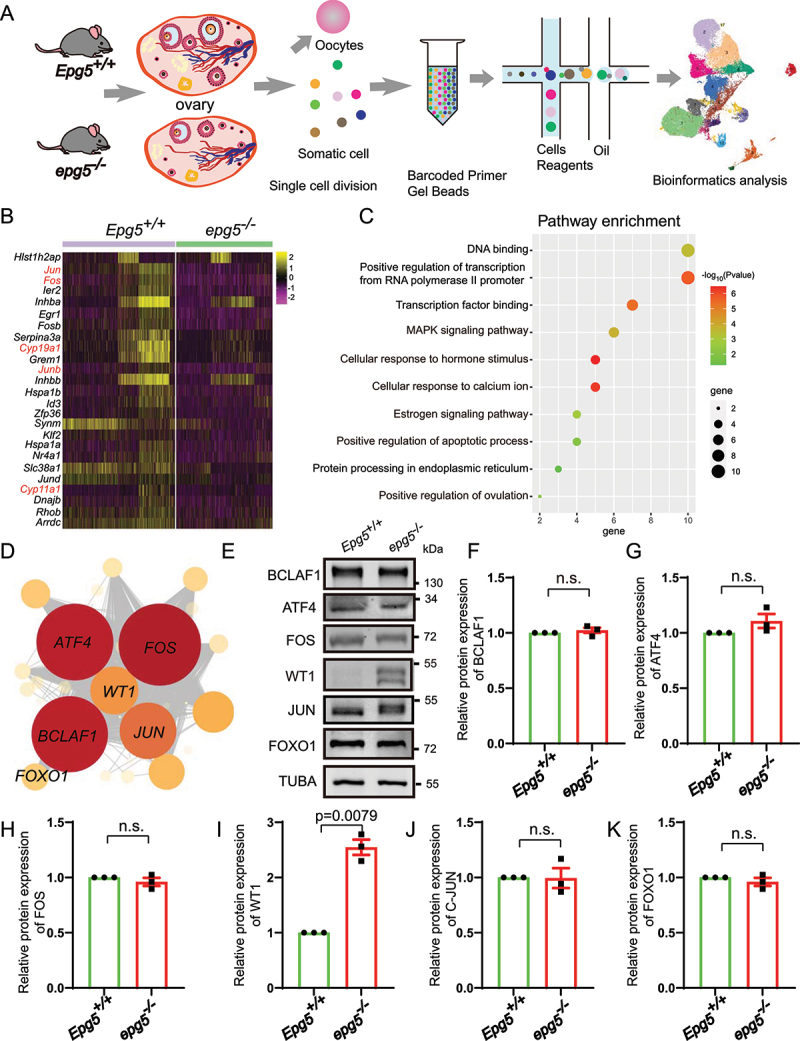
Single-cell RNA-seq analysis uncovers altered functions in epg5 knockout GCs. (a) Schematic representation of ovarian tissue preparation for the single-cell transcriptome analysis. (b) Heatmap showing the expression levels of DEGs in GCs. (c) GO enrichment showing the terms associated with downregulated genes (with adjusted P value lower than 0.01) from epg5 knockout GCs. (d) Regulatory network visualizing potential key transcriptional regulators in DEGs in GCs. The node size indicates the number of target genes associated with corresponding transcription factor. The edge size indicates the weight of the connection. (e) Immunoblotting for the BCLAF1, ATF4, FOS, WT1, JUN and FOXO1 protein, and TUBA (internal control) levels in ovaries. (f-k) Summary of quantification data from E. All experiments were repeated at least three times. Data are expressed as the mean ± S.E.M. n.s., nonsignificant.
