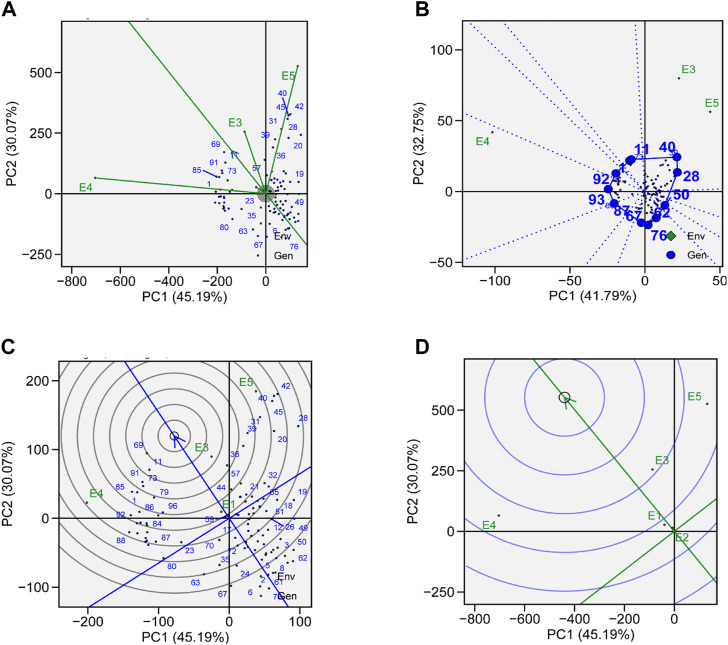
FIGURE 7.
(A) Genotype plus genotype × environment interaction (GGE) biplot analysis for representation and discrimination of genotypes. (B) The which–won–where biplot for the yield of 96 soybean genotypes evaluated in five environments. (C) The best genotypes based on average performance and stability are displayed in a yield-focused comparative biplot. (D) Environment-focused comparison biplot explains the ideal environment for soybean yield among the locations used in evaluations.

