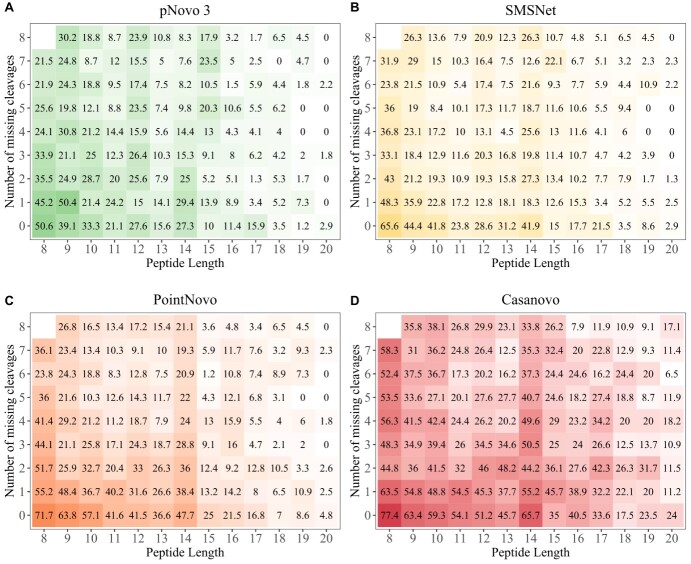
Figure 4.
Heatmap showing peptide recall for different number of missing cleavages (y-axis) and peptide lengths (x-axis). Higher peptide recall is shown in green for pNovo 3 (A), yellow for SMSNet (B), orange for PointNovo (C) and red for Casanovo (D). Lower peptide recall is displayed in white. Spectra are not distributed uniformly and the squares on the right and top of the plots include fewer spectra, since combinations of long peptides and a high number of missing cleavages (top right) occur less likely.

