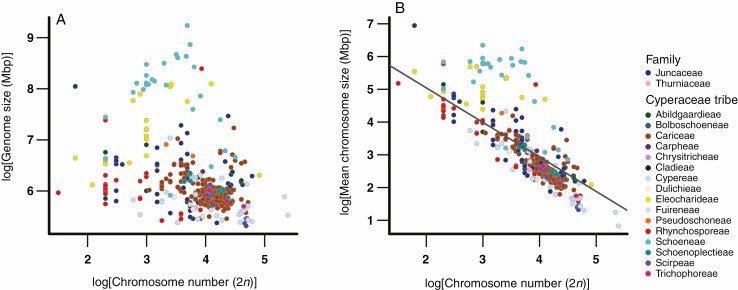
Fig. 3.
The association between diploid chromosome numbers and holoploid genome size (1C; A), as well as mean chromosome size (2C/2n; B) across the cyperids. Values corresponding to the Juncaceae and 16 tribes of Cyperaceae are indicated by the colours shown to the right-hand side of (B). All data were log transformed. Statistical significance (P <0.05) between variables, as determined by phylogenetic generalized least squares (PGLS) performed using the R package CAPER v.1.0.1 (Orme, 2013), is indicated by a solid regression line.

