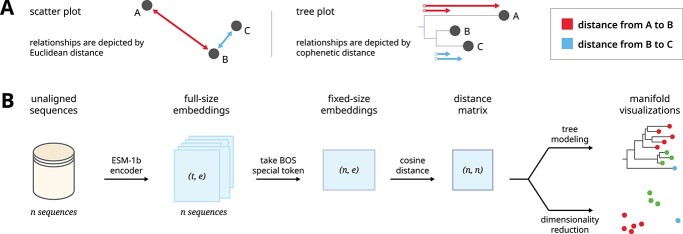
Figure 1.
A graphical overview shows our pipeline for generating manifold visualizations for protein sequence embeddings. (A) Scatter plots and trees can both be used as general strategies for visualizing manifolds. (B) A dataset of unaligned protein sequences is encoded into embedding vectors using the ESM-1b protein language model. The dimensions of the full embedding vector, and the direct output of the encoder, depend on the length of the encoded sequences. In order to facilitate comparisons between sequences, we generated fixed-size embeddings using the beginning-of-sequence special token of each full-sized embedding. Finally, we calculated an all-versus-all distance matrix between each sequence representation which was subsequently used to generate manifold visualizations.

