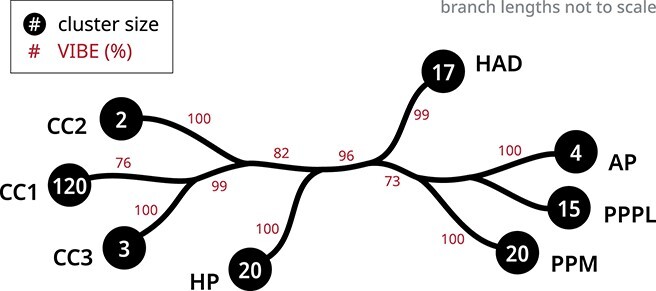
Figure 5.

A condensed tree shows a hierarchical clustering scheme for human phosphatase enzymes. The black circles at each tip indicate the number of sequences within each phosphatase fold. The clustering confidence of each branch was quantified using VIBEs (500 replicates) shown as percentages in red. The unlabeled branches indicate paraphyletic groups. The full tree is provided in Supplemental Figure S4.
