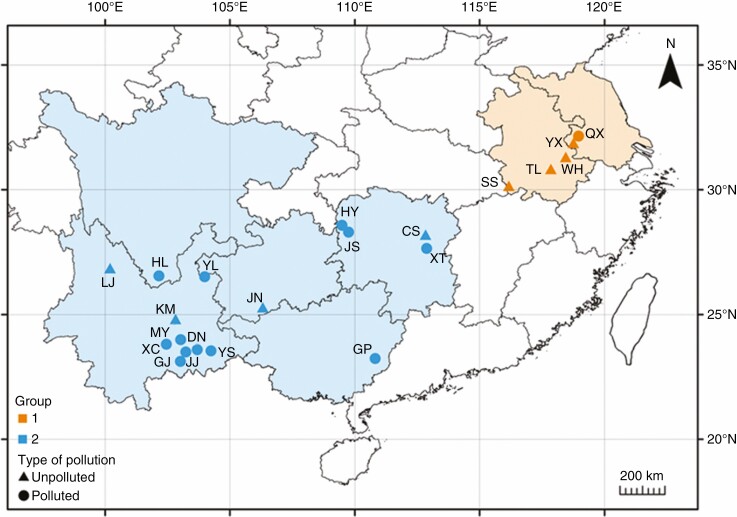
Fig. 1.
Sampling locations of Chenopodium ambrosioides populations. Orange and blue represent groups 1 and 2, respectively. The circles and triangles represent populations collected from heavy metal-polluted and unpolluted areas, respectively. The detailed information of locality, habitat, longitude and latitude of each population is shown in Supplementary data Table S1.

