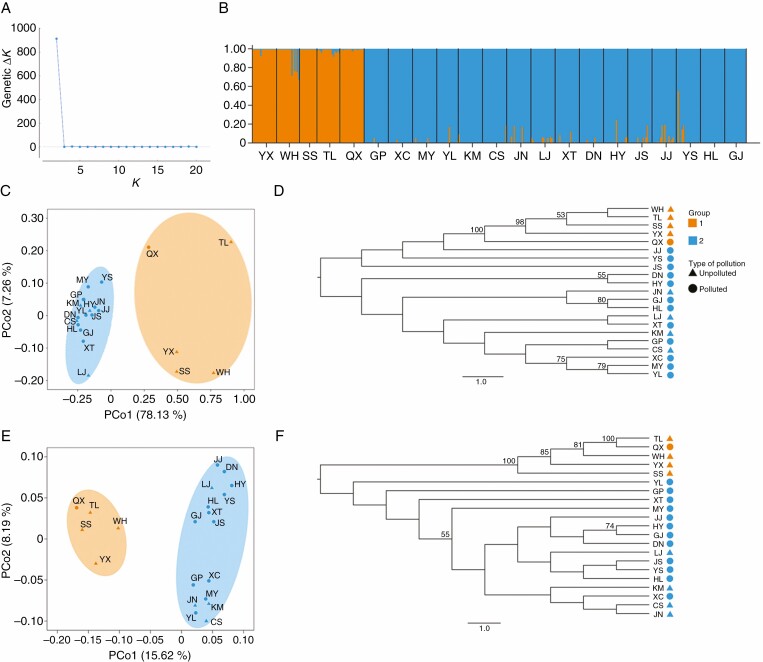
Fig. 3,
Population structure of C. ambrosioides-based genetic and epigenetic data. (A) ΔK plot in STRUCTURE analysis. (B) Individual assignment to each STRUCTURE cluster for K = 2 based on genetic data. Each individual is represented by a thin vertical line. (C–F) PCoA and NJ analysis of C. ambrosioides based on the SSR profile (C, D) and MSAP profile (E, F). PCo1 and PCo2 represent the first two principal co-ordinates of the dataset, which explain 85.39 % of total genetic variation and 23.81 % of total epigenetic variation.

