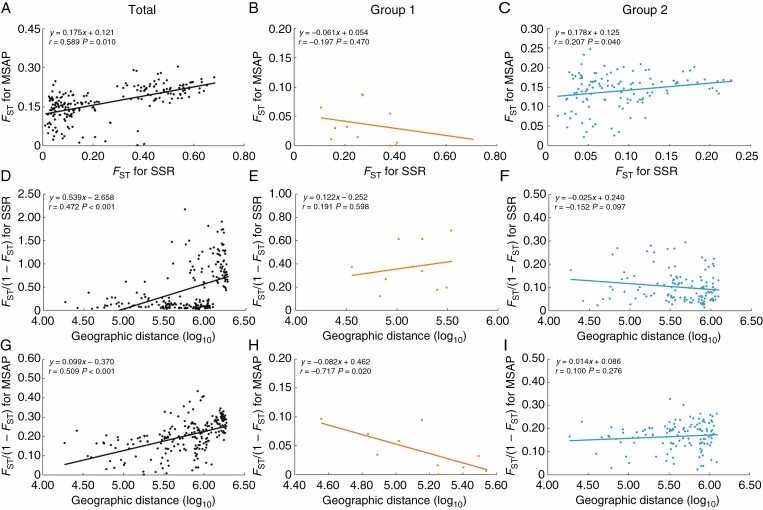
Fig. 4.
Correlations between genetic and epigenetic variations (measured by FST) among C. ambrosioides populations in total (A), group 1 (B) and group 2 (C). Spatial autocorrelation pattern detected for genetic (D–F) and epigenetic (G–I) variations (measured by FST/1 – FST) among populations in total (D, G), group 1 (E, H) and group 2 (F, I). Geographic distance is log-transformed. r = correlation coefficient, P = significance of correlation.

