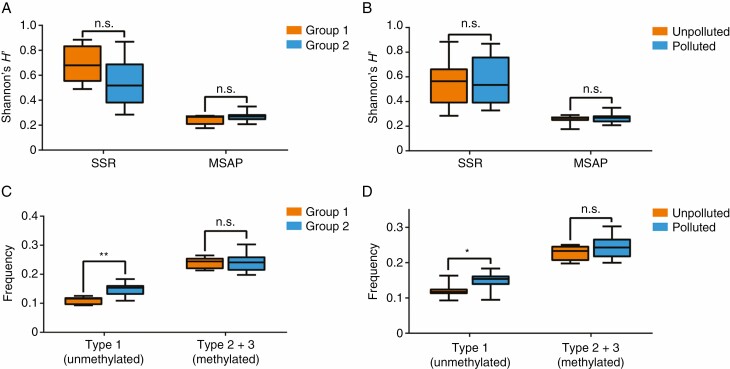
Fig. 5.
Magnitudes of genetic and epigenetic variation among C. ambrosioides populations based on SSR and MSAP. Shannon’s diversity in groups 1 and 2 (A) and in heavy metal-polluted and unpolluted areas (B); frequency of two types of methylation, including type 1 (no methylation) and type 2 + 3 (total methylation), between groups 1 and 2 (C) and between heavy metal-polluted and unpolluted areas (D). Boxplots indicate medians, 25th and 75th percentiles and minimum and maximum values. Significance based on the Student’s t-test is indicated as n.s. P > 0.05; *P < 0.05; **P < 0.01.

