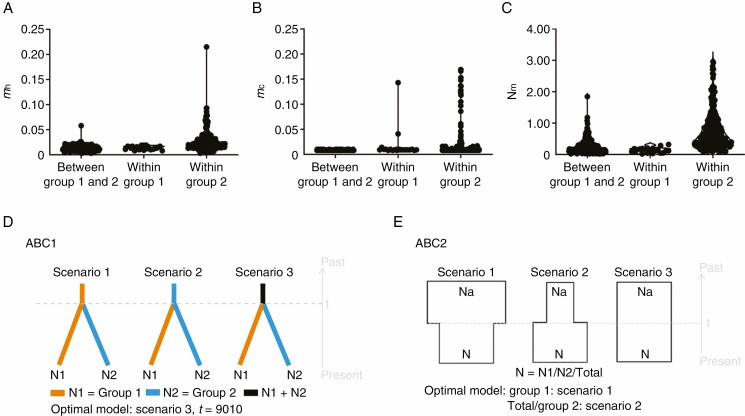
Fig. 6.
Violin plot of gene flow (Nm) (A), historical migration rates (mh) (B) and contemporary migration rates (mc) (C) based on all 21 populations of C. ambrosioides. (D and E) Conceptual models for assessing the demographic history of C. ambrosioides by approximate Bayesian computation (ABC). ABC1 (D), the three scenarios tested to estimate the divergence time between two population groups based on genetic clustering in STRUCTURE analysis. ABC2 (E), the three scenarios tested to assess the changes in effective population size. N represents the effective population size of the corresponding population group during the relevant time period, and t represents the time scale measured in the number of generations.

