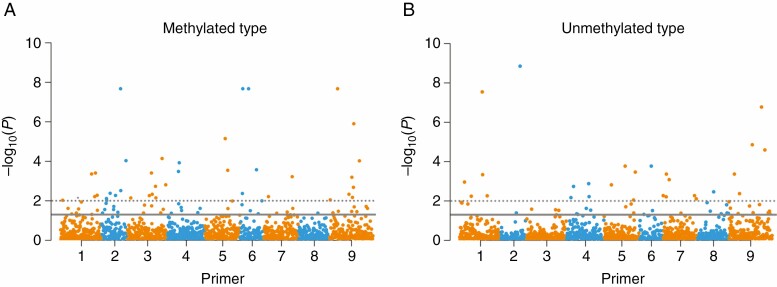
Fig. 8.
Manhattan plots of total methylated (A) and unmethylated loci (B) significantly associated with leaf heavy metal contents of C. ambrosioides. The x-axis represents different loci amplified with eight MSAP primer pairs (Supplementary data Table S9), and the y-axis represents –log10 (P-values). The solid line indicates P < 0.05, and the dashed line indicates P < 0.01.

