
Figure 11.
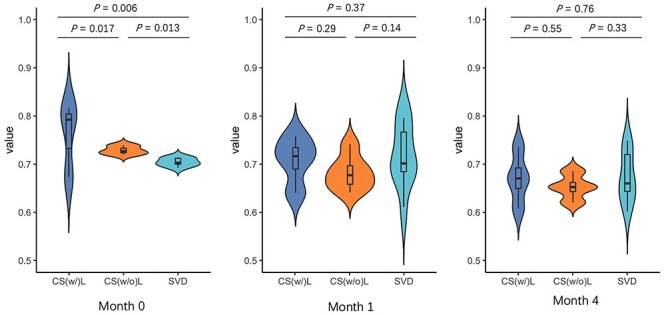
Violin plot in different delivery type: C-Section with labor (CS(w/)L), C-Section without labor (CS(w/o)L), and SVD. To control variables, we group the samples according to the ages. The Y-axis represents the percentage of temperate phages in each sample.