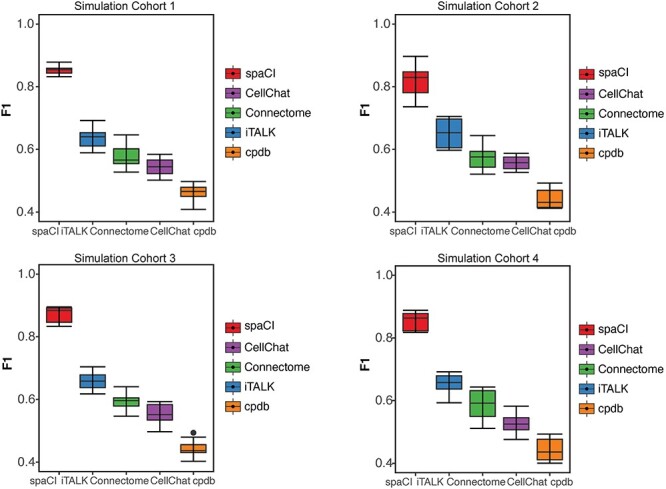
Figure 2.

Evaluation of L–R pairs identified by different methods in simulation data. L–R pairs are predicted by five methods based on four simulation cohorts. Each cohort consists of 10 simulation data generated with different parameters. The corresponding boxplots represent the F1 score of the interaction pairs identified by each method.
