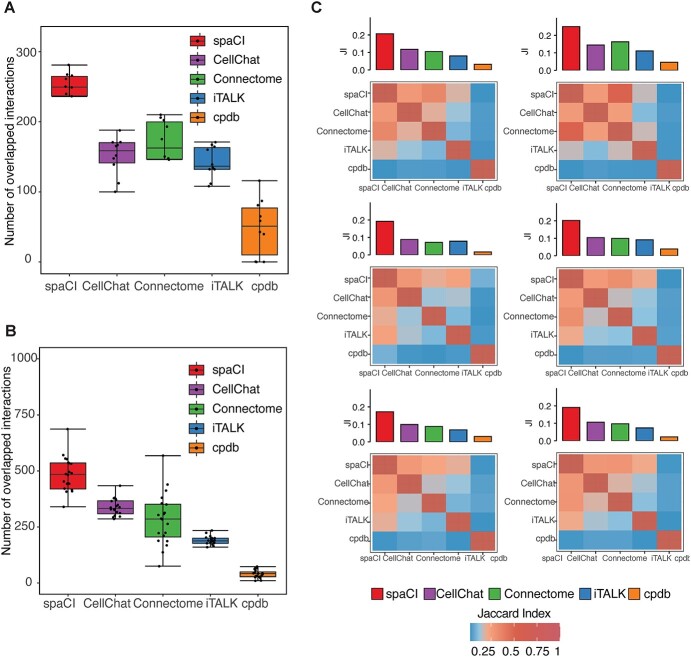
Figure 3.
Evaluation of L–R pairs identified by different methods in SCST datasets. (A) Boxplots represent the number of L–R interactions shared by each method with the rest ones, based on the 10 regions of MERSCOPE colon tumour spatial data. (B) Boxplots represent the number of shared interaction pairs, based on the 20 FOVs of NanoString CosMx data. (C) Heatmap shows the Jaccard index of L–R interactions between any two methods. The filled colour is proportional to the Jaccard index. The average Jaccard index between a given method and the rest of the methods is shown in the bar plot above the heatmap.

