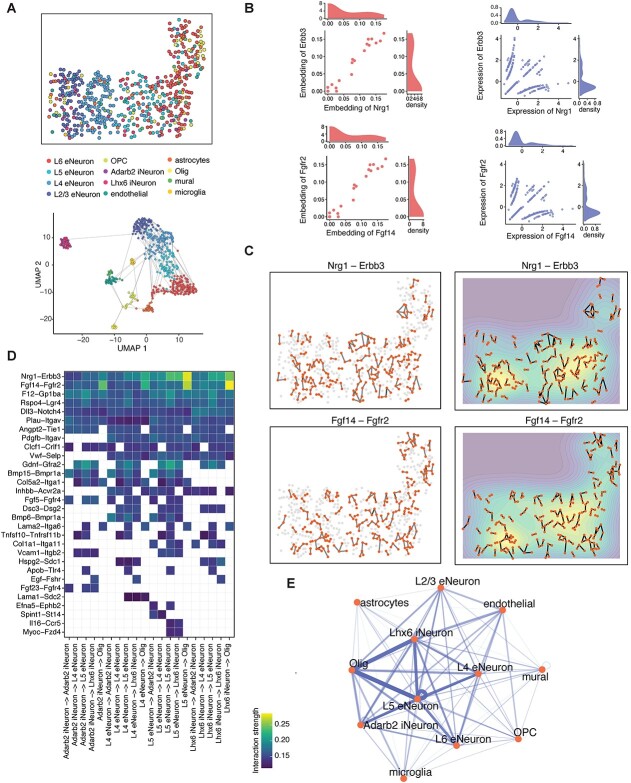
Figure 4.
spaCI reveals L–R interactions in the seqFISH+ data of mouse cortex. (A) The spatial plot of cells profiled from mouse cortex data by seqFISH+. UMAP plot of the profiled cells with edges linking adjacent ones. (B) The scatter plot shows the embeddings and the scaled expression values of identified L–R interactions, including Nrg1−Erbb3 and Fgf14−Fgfr2. (C) The left panel shows the spatial plots of cells expressing Nrg1−Erbb3 and Fgf14−Fgfr2. The right panel shows the contour plots of two L–R interactions. (D) Heatmap shows the identified L–R interaction strength across different cell types. (E) Network diagram of the summarized communications between different cell types. The edge width represents the communication strength.

